Why ProfiShark is used for packet capture, especially in TSN networks

Importance of capturing network traffic

Capturing network traffic involves accessing and recording the data that travels over a network. There are several
reasons and use cases for capturing network traffic.

Figure 1: Reasons and use cases for capturing network traffic.

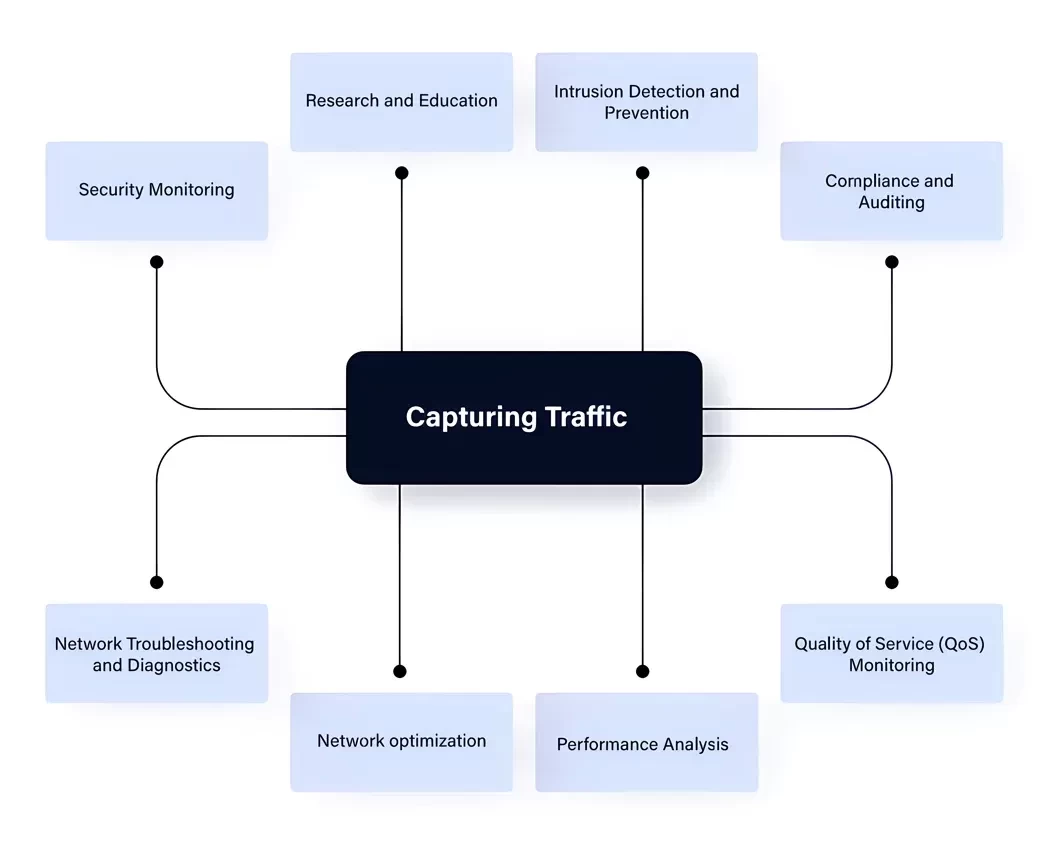
The first reason is Network Troubleshooting and Diagnostics. An inoperational network or a bad performance event often
requires packet capture tools to gather data and analyze for root causes.

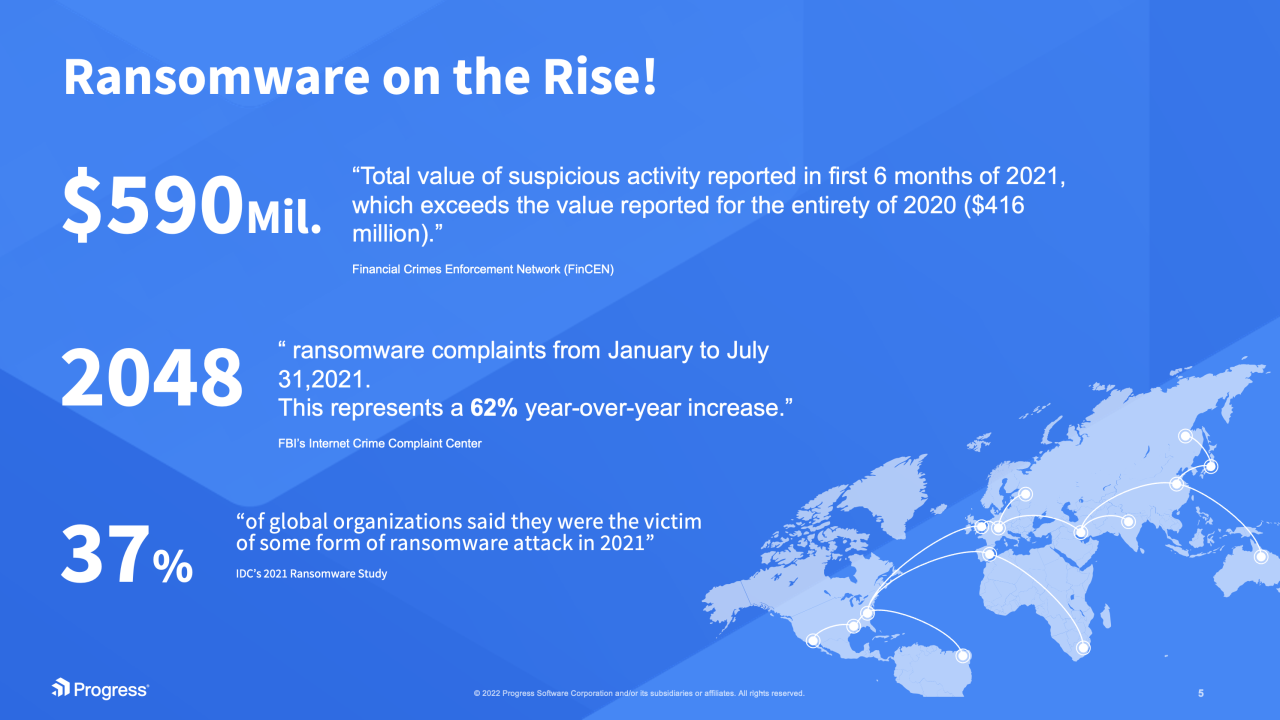
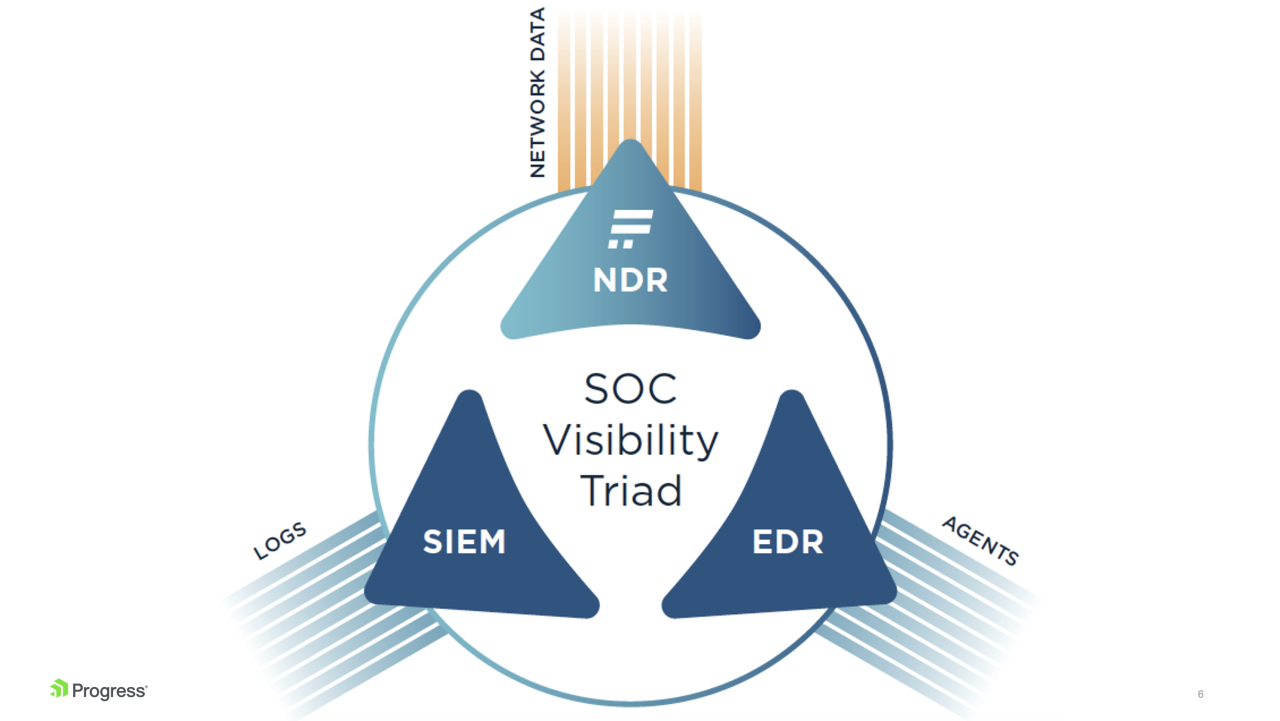
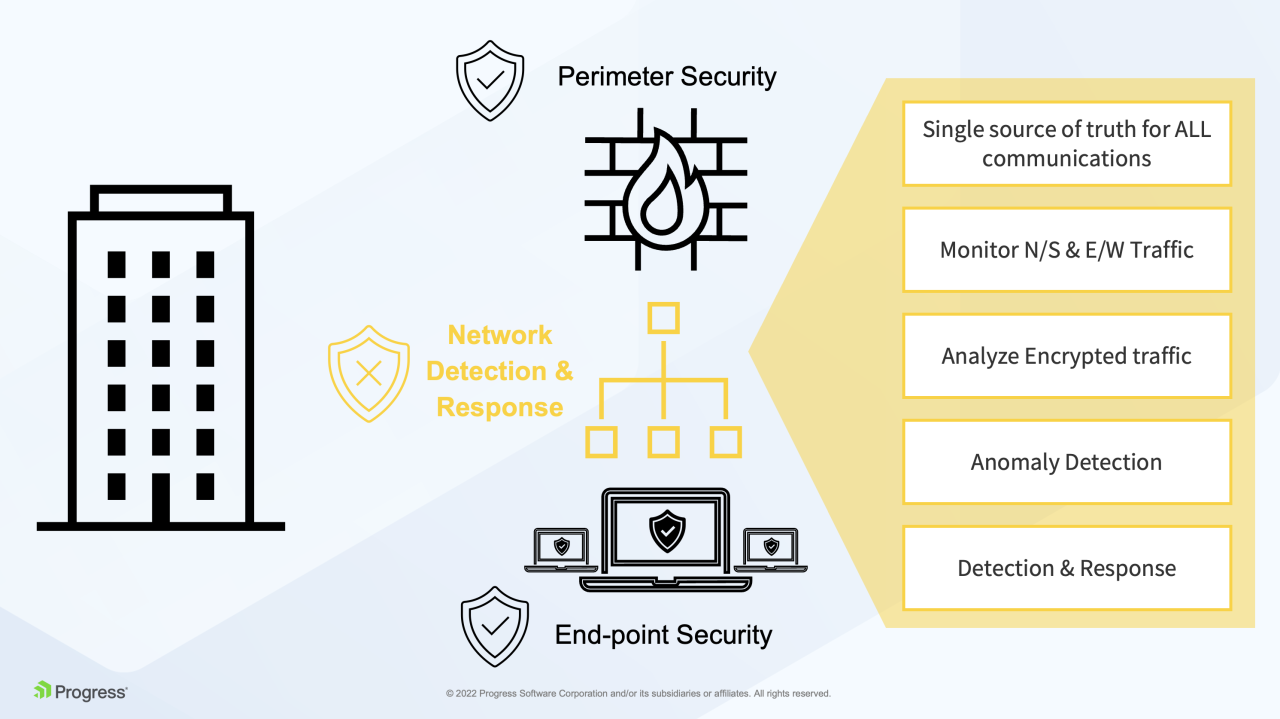
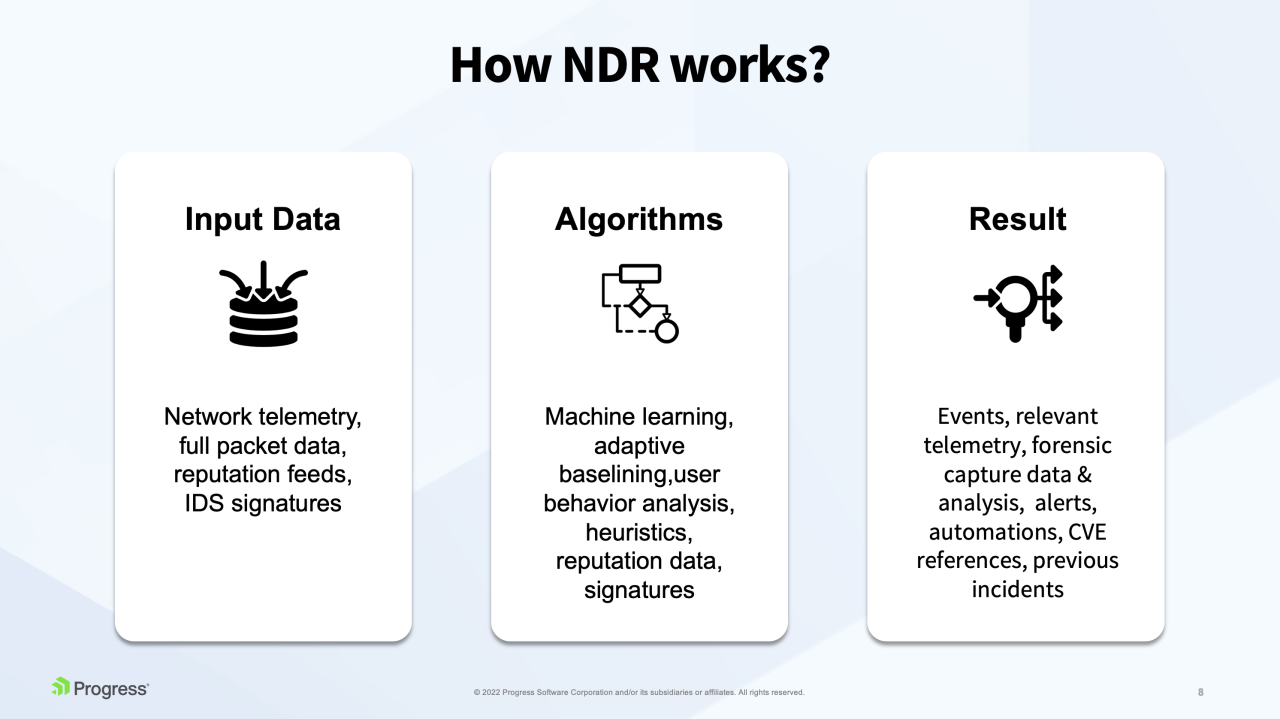
Security Monitoring is also an important driver, allowing security or forensic teams to detect and investigate potential security breaches, intrusions, and malicious activities. By examining network packets, they can identify suspicious or unauthorized traffic patterns and take appropriate actions.

Another reason to capture traffic is performance issues. We can use traffic capture to assess the performance of applications or services running over the network. It can help optimize network performance and identify bottlenecks or inefficiencies in data transfer.

It is also possible to capture traffic to verify compliance and complete audits. Many organizations must adhere to regulatory standards and compliance requirements, often involving monitoring and retaining network traffic data. Packet capture helps organizations demonstrate compliance with data retention and security regulations, like using specific TLS versions and ciphers.

Why capture with dedicated Hardware?

Capturing network traffic with dedicated hardware has several advantages over software-based approaches. Dedicated hardware is optimized for packet capture, offering higher performance and throughput without significantly impacting system resources. Another aspect is a greater precision and a lower probability of lost frames. Additionally, dedicated traffic capture devices can implement high-precision hardware timestamping and provide isolation between the capture process and the production network, keeping the operational network secure.

Switched Port Analyzer (SPAN) to export traffic to a station like a capturing host has a few limitations. There’s a high probability of oversubscribing to SPAN destination ports because send and receive directions of bi-directional traffic are sent out of a single output port. TAP solutions solve this restriction by exporting traffic to separate destination ports for each direction. To receive these two TAP outputs, the destination needs two network ports. On portable devices like laptops, this can be a problem, as they rarely include many Ethernet interfaces.

Figure 2: TAP vs. SPAN.

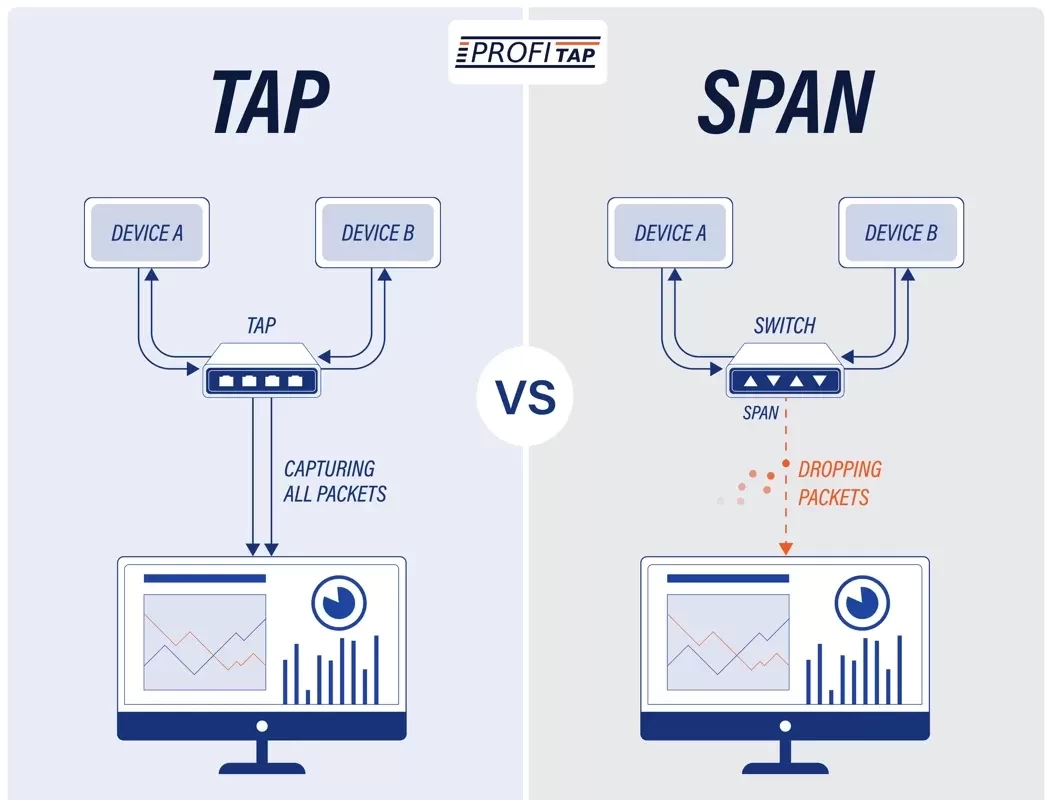
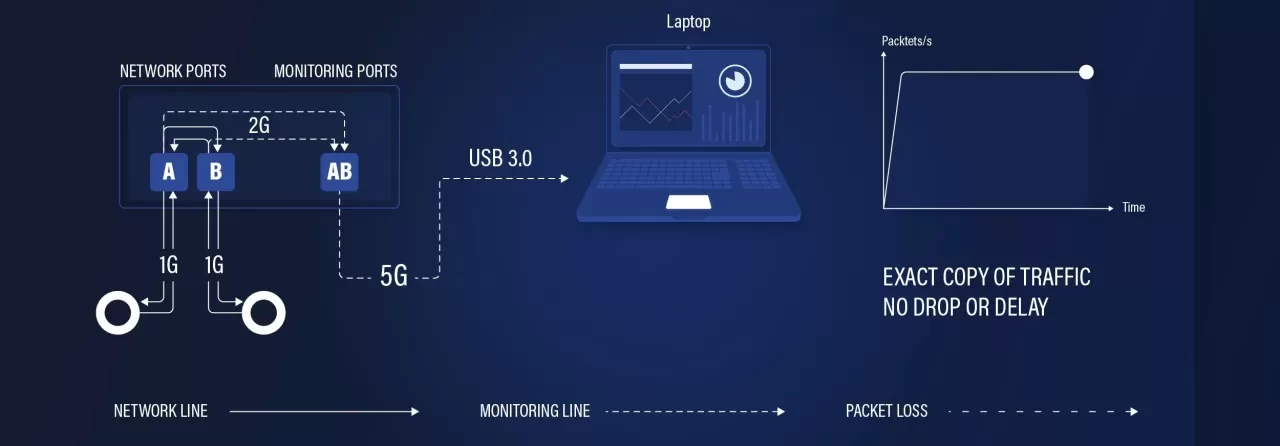
ProfiShark solves this challenge by integrating a TAP with a USB 3.0 output port, which has enough bandwidth to aggregate the send and receive direction of a 1 Gbit/s link.

ProfiShark helps get the exact packet delta and absolute time as it was on the wire through hardware timestamping on the ingress ports and enables capturing the entire frame with the Preamble, including CRC failures on the wire, regardless of frame rate, burst, or frame size. This way, ProfiShark offers unparalleled performance in a portable form factor, making it ideal for capturing high-fidelity traffic in the field.

Figure 3: Profishark 1G schematic overview.

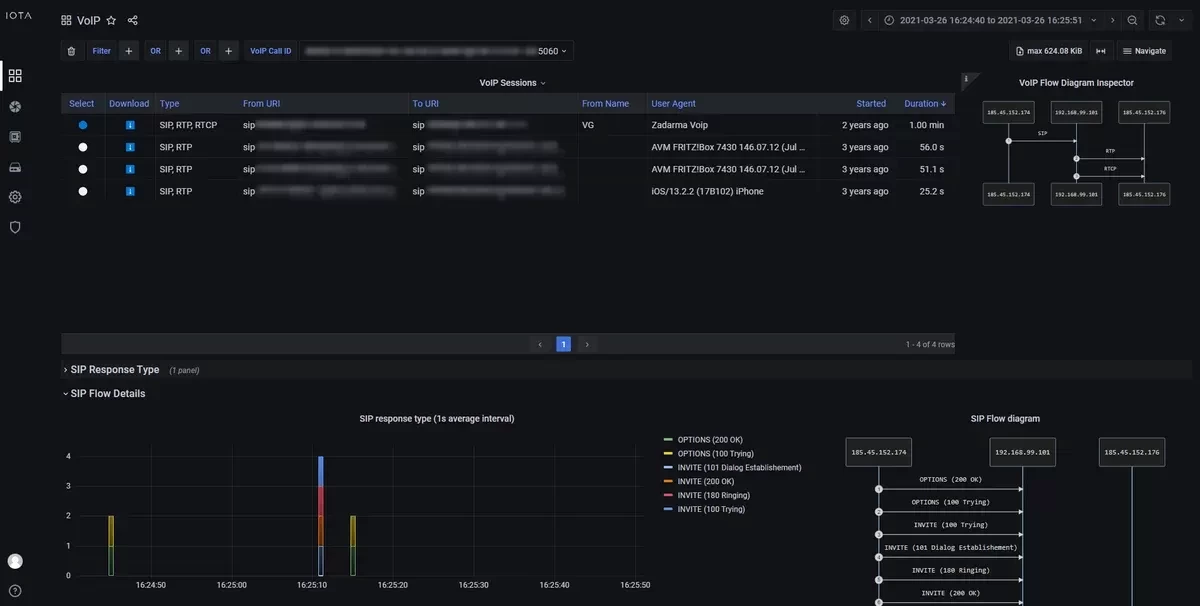
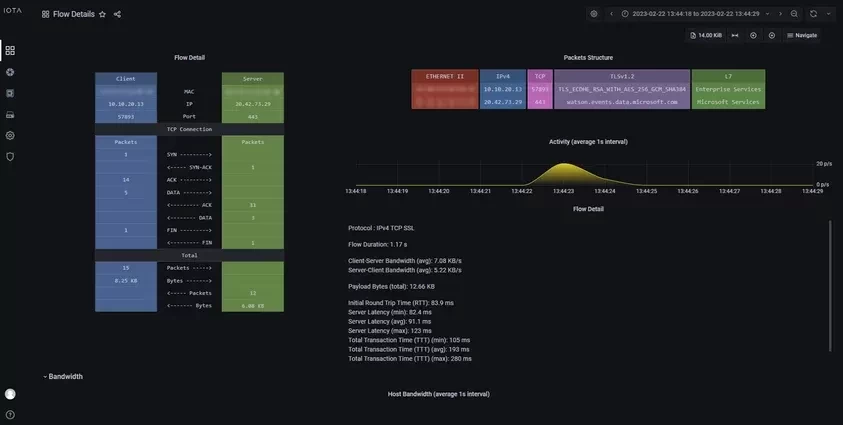
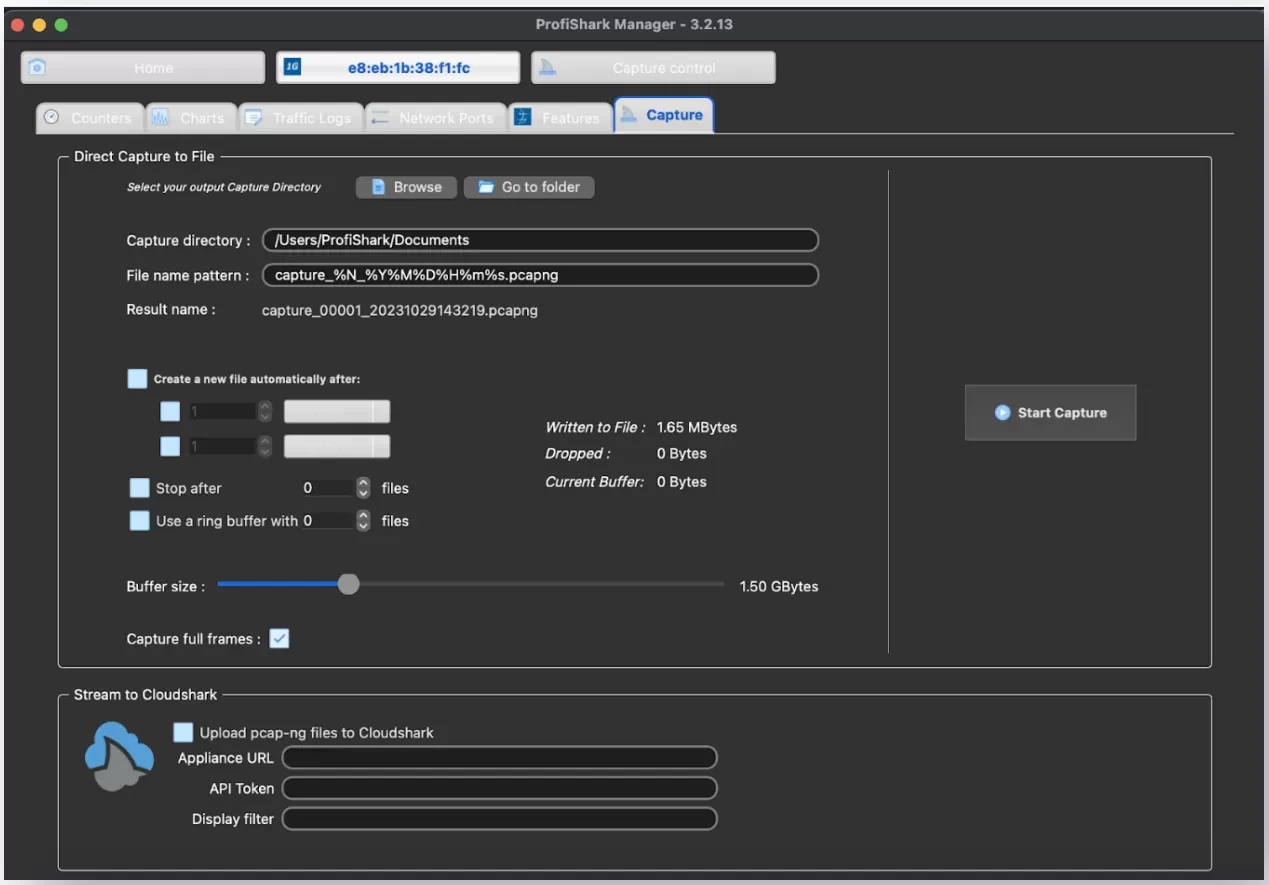
Traffic capture can be started in ProfiShark Manager, and PCAP capture files are saved directly in a specific user-defined folder. Ring buffers, splits, or stops at specific sizes and files are also possible.

Figure 4: Capture options to capture directly to a user-defined folder.

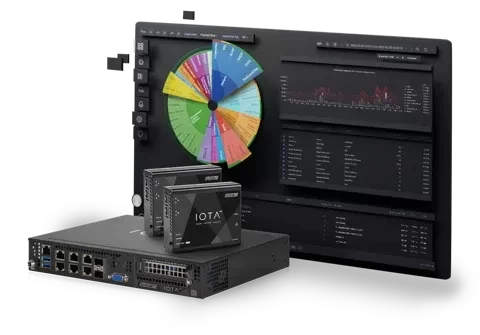
How to capture traffic with ProfiShark?

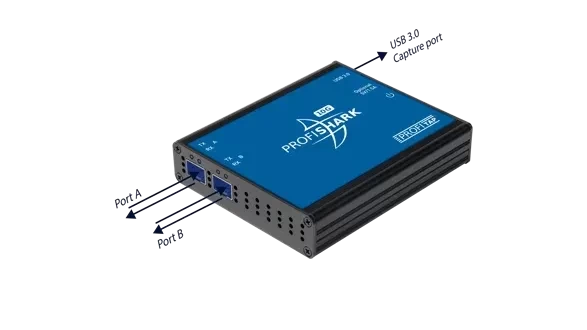
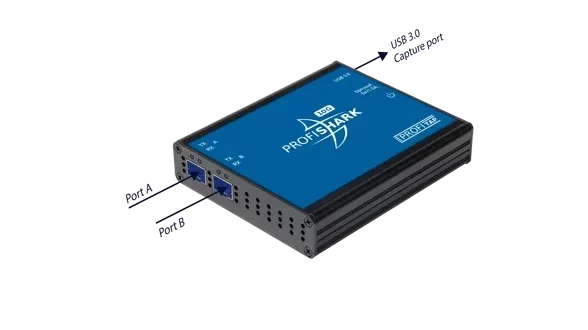
ProfiShark is a hardware-based network TAP (Traffic Access Point) that allows you to capture network traffic with precision and reliability. It features two Ethernet network ports: two 1 GBASE-T ports on the ProfiShark 1G and 1G+, and two SFP+ ports for 10GBASE connections on the ProfiShark 10G and 10G+. It differentiates from other TAPs by exporting captured traffic to a USB 3.0 port. The USB port can be connected to PCs running any number of operating systems. It can include hardware timestamps. 1G+ and 10G+ models include a GPS receiver for accurate timestamping and a PPS in/out port for timestamp synchronization.

ProfiShark supports Inline Mode, so you can introduce it in the production traffic path and SPAN mode, where it can receive out-of-band traffic on both ports.

Figure 5: Operation modes of ProfiShark.

If you capture in Inline Mode, ProfiShark 100M and 1G models fail to wire, meaning the network connection is maintained in case of power loss. PoE passthrough is also supported for easily capturing VoIP phone or IP camera traffic.

You can decide if you want to capture directly to disk or use a virtual Ethernet interface in software-based capture solutions like Wireshark or on the CLI with tshark. Long-term traffic capture is also possible with intel-based Synology NASes, which is especially useful when troubleshooting intermittent problems or capturing large datasets.

Where should I capture traffic?

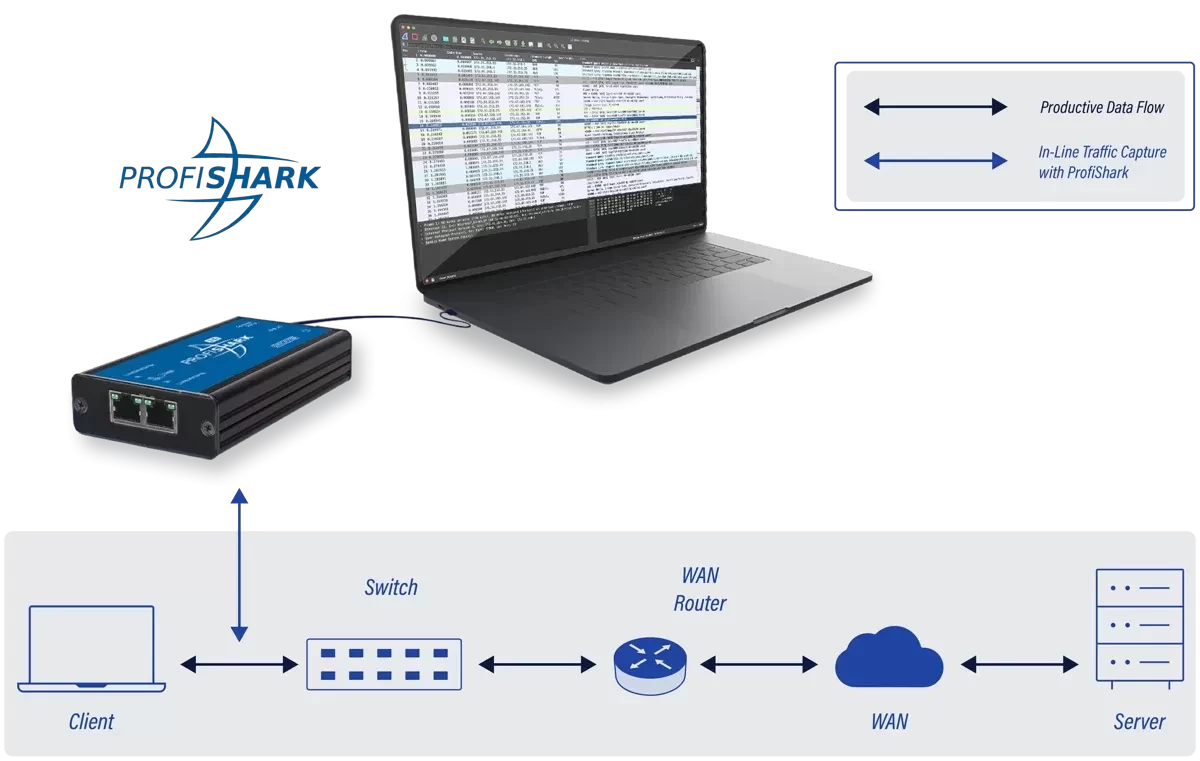
The location at which you should capture network traffic depends on your specific goals and the nature of your network monitoring or analysis task. In troubleshooting scenarios, you should place it close to the host where the problems occur. In the figure below, ProfiShark is placed between the access switch and the client who experiences problems.

Figure 6: Troubleshooting Scenario

How can ProfiShark help find problems in time-sensitive networks?

Time-Sensitive Networking (TSN) has some specific requirements in a network. TSN defines a set of standards defining mechanisms for transmitting time-sensitive data over Ethernet networks. This includes traffic such as audio and video bridging, automotive applications, and industrial processes like robotic applications.

They are very sensitive to variations in packet transmission like jitter, high delay, and packet loss. For example, retransmission is not possible over live audio video bridging. If transmission violates the deadline expiry, rather than experiencing a delay while waiting for a recall of the missing packets, the transmission moves forward with degraded quality. The same occurs with lost packets, causing choppy or robotic sounds in audio, pixelated video, or pictures with artifacts.

ProfiShark 1G+ and 10G+ are especially suitable for these environments because of their hardware timestamping with 8 ns resolution and advanced GPS/PPS timestamping features, providing high accuracy in measurement.

ProfiShark is capable of full Layer 1 passthrough for all frames, tags, and encapsulations. There is no cut-off of CRC-invalid frames or fragmented traffic. ProfiShark enables us to see preempted frames like in IEEE 802.1Qbu or 802.3br traffic. Another challenge in troubleshooting TSN is avoiding the introduction of additional latency or jitter in Inline mode. This is minimal and constant in ProfiShark, which makes it perfectly suitable for IEEE 802.1AS and 1588 v2 traffic.

What are the advantages of using ProfiShark?

ProfiShark is a dedicated hardware solution for network packet capture and monitoring. It offers several advantages that make it a valuable choice for professionals and organizations seeking high-precision packet capture and analysis. It is extremely compact, so it suits every troubleshooter’s emergency package. ProfiShark is easy to deploy, and there is no loss in 1G network links in Inline mode.

This specialized TAP can handle large volumes of network traffic without impacting system resources, making it suitable for high-speed networks. It provides high accuracy with hardware timestamping and GPS receivers on plus models. Troubleshooters can see the whole frame as it traverses the wire, so they can even detect CRC failures in frames. ProfiShark manager allows for capturing traffic without dependency on the analysis software.

Synchronized Digital Clocks: Advantages and Considerations

When it comes to choosing clocks for your facility, you have a choice between digital or analog displays. Both styles have their merits, so it’s important to consider your needs and priorities. Here’s a look at some key characteristics of digital clocks, that can help you decide what to use.

Easier to Read

Digital clocks are super easy to read at a glance. This makes them a great choice for large spaces like gyms, auditoriums, or open floor plans where you need people to be able to tell time from far away. A 4-inch digital display can be read clearly from over 250 feet. You can also choose between different colours Red, Green, Amber or White.

Low Light Rooms

Digital clocks are better suited for dark rooms or rooms with dim lighting, like auditoriums during presentations. No need to strain your eyes – digital clocks glow bright so everyone can keep track of time even when other lights go down.

When Seconds Count

Digital clocks are precise down to the second. This is handy when seconds really count, like during exams, a time sensitive production process, or critical medical procedure. No more estimating – everyone will know exactly how much time is left.

Advanced Features

Digital clocks can accomplish some additional features that analog clocks cannot. You can use a digital clock as an elapsed timer to help everyone track how much time has passed. This can be invaluable to monitor medical procedure time, keep students moving between classes or help manufacturing gain visibility into task durations to improve efficiency.

Messaging System

Digital clock can also be used to display messages, this can provide an important messaging capability. During normal operation the clock can display accurate time and switch to mass message capability across your facility for critical alerts or general messaging. Message clock systems can bring visual notification to your facility, especially in busy noisy environments like hallways, lobbies, gymnasiums, stairwells, or office spaces.

Budget

Of course, digital clocks usually cost more than analog. Be sure to consider your budget, especially if outfitting an entire building. Analog clocks have a classic esthetic look. So weigh technology needs versus style preferences.

In the end, digital clocks offer unbeatable readability and functionality in most situations. Just account for the potential higher price tag. Now you have what you need to choose the display format that’s right for your facility!

What is Network Detection and Response and How Does it Work?

Network Detection and Response (NDR) is a cybersecurity approach that focuses on identifying and mitigating malicious activities in real-time.

NDR is an indispensable piece of an overall security operation strategy.

So, what is Network Detection and Response (NDR)? Network Detection and Response uses non-signature-based techniques (as opposed to the signatures used by anti-virus/anti-malware) such as machine learning to spot anomalous and suspicious traffic that could point to a cyberattack. NDR solutions deeply parse raw network traffic and flow data to build models that define what traffic is normal on the network and can then spot deviations which prompt alerts.

“In addition to monitoring north/south traffic that crosses the enterprise perimeter, NDR solutions can also monitor east/west communications by analyzing traffic from strategically placed network sensors. Response is also an important function of NDR solutions. Automatic responses (for example, sending commands to a firewall so that it drops suspicious traffic) or manual responses (for example, providing threat hunting and incident response tools) are common elements of NDR tools,” argues Gartner.

While NDR can address myriad network issues, it is especially adept at dealing with hack attacks. We’ll use ransomware as just one example.

How Network Detection and Response (NDR) Addressed Ransomware

Ransomware attacks occur at an ever-quickening pace, crippling organizations and costing millions of dollars in ransom payoffs, lost productivity and diminished consumer confidence.

One accelerant is Ransomware as a Service (RAAS), readily found on the Dark Web. Threat actors look to make attacks easier, and what could be easier than an attack that is pre-built and offered as a service?

The Sophos State of Ransomware Report 2021 shows that the average cost to deal with an attack in 2021 was $1.85 million. This was up from the 2020 average of $761,106. These costs cover all the activities required to recover from a ransomware attack. These include paying the ransom, the costs associated with business disruption when IT systems are unusable, operational downtime for machinery and other plant devices usually controlled by IT systems, staff overtime payments during the recovery period and more. Within the 2021 figures, the actual ransom payment average was only $170,404.

The Security Operations Center (SOC) Visibility Triad

While solutions such as NDR tools are critical to network and IT security, having a framework in which NDR fits is just as vital. One such approach is the SOC Visibility Triad, a concept created by Anton Chuvakin of Gartner, which postulates that deploying complementary security tools that make up for each other’s shortcomings will significantly reduce the chances that an attacker will be able to achieve their goals.

The Triad’s three pillars are:

  • EDR for endpoint security,
  • SIEM for processing logs and correlating events, and
  • NDR for behavior analysis from the network perspective.

Today’s top security teams turn to a security model that extends log management and end-point protection with network detection and response tools. The NDR pillar compensates for the weak points of the other two pillars, SIEM and EDR, and together gives full visibility across complex IT environments.

Each of these segments addresses a different part of the anatomy of an attack. IT should have all three pillars covered to increase the probability of catching attacks – and catching them early. Lets dive into each pillar.

Security Information and Event Management (SIEM)

The first pillar is SIEM (Security Information and Event Management) and UEBA (User and Entity Behavior Analytics).

Some experts believe that over 80% of successful hacks are related to compromised credentials – a big part of the exploit world. That’s why having a deep understanding of what normal behavior looks like versus what abnormal behavior looks like is vital.

Let’s say someone tries to log in 200 times in less than a second. This is an activity you should do something about quickly, such as cutting that device off from the network.

In a large user environment, IT needs a way to collect all relevant logs, aggregate them and analyze them. Imagine dealing with it all manually, poring through thousands of logs. This doesn’t work for a small shop and it certainly doesn’t scale for enterprise networks.

The point is that user behavior analysis and log aggregation are so key.

End Point Detection and Response (EDR)

The second Pillar is EDR, or End Point Detection and Response. When an asset or set of assets is compromised, cybercriminals are one step closer to now getting privileged access – a real disaster.

Network Detection and Response (NDR)

The third pillar, Network Detection and Response, is still sometimes called network traffic analysis (NTA), but evolved into NDR as the solutions grew.

NDR is about identifying intrusions across the network, as well as:

  • Offering a way to triage issues,
  • Narrowing down to what really matters, and
  • Filtering out the noise

NDR lets incident responders and SOC operators get to the items that truly matter, staying ahead of issues and determining their actual impact state.

The idea is to catch the exploit at the beginning, seeing the footprints before the full impact of the exploit emerges. NDR is about finding and detecting those “small wins” helping you to understand what’s anomalous so that you can then stop it and prepare for the next time that it happens.

“NDR solutions primarily use non-signature-based techniques (for example, machine learning or other analytical techniques) to detect suspicious traffic on enterprise networks. NDR tools continuously analyze raw traffic and/or flow records (for example, NetFlow) to build models that reflect normal network behavior,” Gartner argued. “When the NDR tools detect suspicious traffic patterns, they raise alerts. In addition to monitoring north/south traffic that crosses the enterprise perimeter, NDR solutions can also monitor east/west communications by analyzing traffic from strategically placed network sensors.”

The diagram below shows where NDR sits and how it is a key source of network truth.

SIEM and EDR are important solutions, but still leave blind spots in the east-west corridor where adversaries can hide after they’ve slipped past perimeter defenses. By taking a network-based approach instead, NDR fills those critical visibility and coverage gaps.

How? Because every asset, whether in the cloud or an on-premises data center, uses the network to communicate. That makes NDR the ultimate source of truth for cloud and hybrid security. Advanced NDR solutions are also capable of monitoring and analyzing encrypted traffic. It is estimated that over 90% of malware is hidden this way.

Early Breach Detection

NDR solutions permanently observe network traffic, analyzing communication to spot anomalies and reveal suspicious behavior. This enables a response to as yet unknown security threats undetectable by other technologies.

The average time taken from identifying a breach to safely containing it was 287 days in 2021. Meanwhile, threat actors are developing new malware every day for which the signature has not been created. That is why an NDR solution that does not rely on signatures, but leverages machine learning (ML), is critical.

The Three Steps of NDR

Data Collection/Algorithms

By applying Machine learning techniques, modeling baselines and analyzing user behavior in the network, NDR tools can uncover hidden malicious activity and alert on it.

The results are where the network security rubber meets the road, as an NDR solution brings all the evidence together in one place where IT can see relevant telemetry data, captured forensic data and analysis.

The traditional method to detect anomalies in network traffic is a statistical analysis looking for traffic spikes and deviations from baselines. While useful for some use cases, this is behavior analysis — not NDR. To truly provide NDR, you need to be able to go beyond traditional statistical analysis and detect threats and attacks that are not volumetric in nature.

Let’s go together beyond the traditional statistical approach and look at a number of different tools an NDR solution can leverage for detection.

Machine Learning (ML)

Machine learning is the magic that continuously computes and analyzes entropy between individual communication parties in the network to distinguish human like and machine-like behavior. This way, NDR solutions detect different types of attacks against network services that demonstrate themselves with a very low entropy due to a repetitive pattern in the network that they generate. For example, if an attacker is doing a slow brute force attack (trying to guess your password) – ML can detect that.

Adaptive Baselining

Then we have something called adaptive baselining. This is not the baselining terms of statistical analysis of the whole data, but rather baselining of individual hosts, determining how they behave in the network and comparing behavior of individual hosts to one another. For example, you can detect that one host is generating much more emails than others in the same network, which may indicate some compromise, spam, or that something is exfiltrated through the DNS and so on.

Heuristic

Then we have heuristic algorithms that look for specific symptoms in the network and work with probability. For example, in peer-to-peer traffic you look for multiple different symptoms and calculate that there is, for example, an 80% probability that a specific device is probably plugged into some BitTorrent network and using BitTorrent download, which is something you don’t want to see in the corporate environment.

User Behavior Analysis

Another example is analyzing user behavior. For instance, IT may know that a certain type of communication does not represent a legitimate pattern in the network. Let’s say someone tries to connect over and over to an SSH, suddenly connects and transfers lots of the data. This will be flagged as a potentially successful attack.

One customer of Flowmon, our NDR solution, detected a suspicious upload of data from a local network into the public data repository. This was hundreds of MB of data, and a specific station in the local network was identified as it source. The customer discovered an ex-employee was trying to backup company data.

Reputation Data

Many NDR vendors include open-source threat intelligence data in their offering to provide additional value. These can be commercial reputation feeds containing known malicious IPs, host names, domain names, JA3 fingerprints, etc.

Response

Response capabilities of NDR solutions can be divided into two groups – Manual Response and Automatic Response.

In their Market Guide for NDR, Gartner recommends deciding early on in the evaluation process if you require automated response versus manual response capabilities.

A clearly defined response strategy is valuable in selecting a shortlist of NDR vendors.

Manual

NDR solutions should provide a deep forensic investigation to help analysts understand advanced threats and attacks. Top NDR products also offer continuous packet capture (PCAP) for on-premises and cloud environments to provide the highest-fidelity evidence source available to investigators. NDR vendors are continuously improving workflow to prioritize events so analysts have everything at their fingertips to validate, triage and establish root cause, which allows them to drive rapid incident response.

For manual response, vendors improve their threat hunting and incident response functions by improving workflow features (for example, helping incident responders prioritize which security events they need to respond to first).

Automatic

For automated responses, NDR solutions focus on other complimentary security solutions to which it can automate a response. For example:

  • FW – send commands to firewalls to drop suspicious traffic
  • NAC(network access control) – send commands to the network access control (NAC) solution to isolate an endpoint
  • EDR – EDR can be instructed by NDR to contain compromised endpoints
  • You can send events detected by NDR to log management tools like SIEM
  • or to SOAR, security operations automation response (SOAR) tools, where you can do event collection and correlation.

One More Framework – The MITRE Attack Framework

MITRE is a government funded research organization that was spun out of MIT. MTRE is also funded by NIST and has connections with government agencies (like CIA, FBI, NSA).

The framework is a blueprint of how threat actors use tactics, techniques and procedures to carry out an attack. It was originally developed to help provide a common language, common vocabulary and way of looking at things for not only vendors but also blue and red teams practicing against each other in cyber arena.

With MITRE, IT can pool resources and efforts to get ahead of potential threat actors. It also provides a useful way to play offense. It’s not just about knowing the anatomy of an attack so that you can prevent it from happening, but pretending to be the attacker in a preparatory way. This way, IT can set up a robust infrastructure for dealing with threat actors and potential attacks in the future.

Latency vs. Jitter: Monitoring network performance

Jitter and latency are critical parameters in assessing and maintaining network performance. Network engineers need to be able to distinguish between them when optimizing network performance.

Latency, the delay in data transmission, directly affects user experience, application responsiveness, and data transfer efficiency.

Jitter is the variation in the delay of packet arrival times. This variation adds a layer of complexity by introducing irregularities in the delivery of data packets.

Types of network latency

Transmission Latency: The time it takes to push all the packet bits onto the network medium.

  • Propagation Latency: The time it takes for a signal to travel from the sender to the receiver.
  • Processing Latency: The time it takes for a networking device to process a received packet and determine where to send it next.
  • Queuing Latency: The time a packet spends waiting in a queue before it can be processed.
  • Serialization Latency: The time it takes for a packet to be converted into a series of bits for transmission.

Understanding the nuances of latency and jitter and employing the right measurement tools are crucial for effective troubleshooting. You can implement targeted optimizations by identifying the specific latency type causing issues, enhancing overall network performance and user experience.

Integrating these measurements into routine monitoring practices ensures a proactive approach to latency management and network optimization.

Impact on network performance

Latency influences the responsiveness of applications and directly affects user perception. High latency can lead to delays in data transfer and increased lag in real-time applications, impacting overall user satisfaction. On the other hand, Jitter can result in inconsistent communication between devices, leading to packet loss, degraded voice and video quality, and disrupted data flow.

Consider scenarios where latency becomes critical, such as in online gaming or video conferencing, where real-time interaction is essential. Jitter issues may arise in voice-over-IP (VoIP) calls, causing voice distortions or dropouts. These real-world examples highlight the tangible impact of latency and Jitter on user experience and application performance.

Methodologies and tools

Network engineers commonly use tools like ping, traceroute, and network analyzers to measure latency. Metrics such as Round-Trip Time (RTT) and one-way delay are crucial for assessing latency. As a dynamic metric, Jitter is often measured using Mean Opinion Score (MOS) for voice quality or tools that analyze packet arrival times.

Engineers analyze network infrastructure when troubleshooting latency, identifying potential bottlenecks, and optimizing routing paths. Jitter troubleshooting involves packet loss analysis and, if necessary, implementing Quality of Service (QoS) mechanisms to prioritize real-time traffic.

Mitigation and optimization

Latency can be optimized by implementing traffic shaping, caching, and load balancing techniques. For example, network packet brokers are an excellent solution for optimizing traffic flow.

Jitter mitigation involves buffering and packet reordering mechanisms. Additionally, network engineers should prioritize bandwidth management, ensure efficient routing, and proactively monitor network health to optimize overall performance.

It’s also good to keep an eye on the tools you use themselves. Every device you add, adds latency. Profitap network TAPs are designed for optimal performance and have a fixed low latency that you can account for. This means you won’t introduce new variables into your system that make troubleshooting harder.

Analyzing latency and jitter issues

Latency issues can happen randomly, so it’s a good practice to have network monitoring tools to help you monitor latency and jitter issues as soon as they pop up.

Profitap aims to make troubleshooting network performance as easy as possible with the IOTA All-In-One Network Traffic Monitoring Solution. IOTA is a powerful network capture and analysis solution for edge and core networks. The IOTA lineup consists of portable EDGE models, high-speed CORE models, and the IOTA CM centralized device management system.

The IOTA solution provides fast and efficient network analysis and troubleshooting capabilities to branch offices, SME businesses, and core networks, such as data centers.

IOTA allows you to capture network traffic without affecting network performance or security and gives detailed real-time and historical network traffic visibility into critical applications and data.

With specialized dashboards, such as the VoIP dashboard, you instantly get an overview of SIP and RTP metrics and MOS scores. Learn more about troubleshooting VoIP on our Knowledge Base.

The TCP dashboard helps you dive deeper into TCP-related statistics, such as client IP, server IP, hostnameshost names, iRTT, and more.

Good to know:

When displaying initial RTT (iRTT), IOTA specifically corresponds to propagation latency, as transmission, queuing, and serialization latencies are neglectable here. When showing application or server latency, the corresponding type is the processing latency.

More dashboards are available:

  • ????
  • ????
  • ????? ??????
  • ??????????
  • ??????
  • ???/???
  • ???
  • ?????????
  •  ???
  •  ???? ???????
  • ???? ???????
  • ????????

Key takeaways

Understanding the differences between Jitter and latency is fundamental for effective network management. Network engineers should prioritize a holistic approach, combining proactive monitoring, strategic infrastructure optimization, and rapid troubleshooting to ensure optimal network performance.

Addressing latency and Jitter issues can enhance user experience, application responsiveness, and the network’s overall efficiency. Profitap IOTA is a valuable asset in the network engineers’ toolbox for these types of network analysis.