Newsletter


For a Free Quote...

Network Instruments Observer Apex

  • Overview

  • Features

  • Integration

  • Deployment

  • What's New

  • Tech Specs

  • Requirements

  • Resources

Network Instruments Observer Apex

High-Level Strategic Vision and Tactical Awareness Get 360 degrees of visibility into network health in a heartbeat.

Observer Apex provides a centralized vantage point for network performance across all of the Observer Performance Management Platform. It combines flow technologies, captured packets, system health, and expert analysis to provide an overall picture of service health. Apex presents integrated views of application, network, and infrastructure performance to ensure critical business processes function smoothly and IT organizational goals are supported.

Standalone, or integrated via RESTful API to any third-party solution, Apex delivers macro and micro reporting with deep drilldown power and provides baselines with real-time and historical views for proactive intervention and assessing future network trends.

What Benefits Does Observer Apex Offer?

  • User-friendly interface with intuitive, web-based functionality
  • Library of pre-built widgets designed to get you up and running fast
  • Widget creation tool for customization of views and easier data sharing
  • Aggregated views of network, application, and device health
  • Navigation from high-level monitoring to root-cause analysis
  • Optimization of performance metrics through baselining
  • Drilldown from performance dashboards into link, user, and connection details
  • Detailed metrics on important applications such as Citrix, Oracle, WebSphere MQ, email, and Web
  • Real-time application health on a global scale with NetFlow
  • Monitoring of end-user experience agnostic to access method
  • Gen2 Capture Card

Understand User Experience

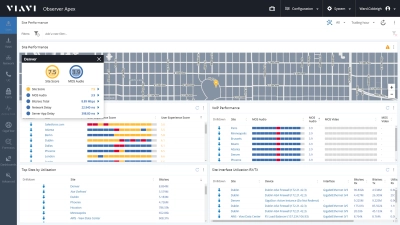
For optimal delivery, Apex provides superior monitoring of the end-user experience. From smart phones to laptops, it offers real-time and historical user metrics neatly packaged in an aggregated display of essential communication data. Color indicators instantly communicate performance status for proactive solution and prompt resolution.

End-user experience metrics include:

  • End-user page response time
  • Transactions processed
  • Traffic flow data
  • Application errors
  • Network errors, latency, and utilization

Intuitive Interface and Workflows

The strength of Observer Apex is the speed and accuracy with which it helps resolve problems. Its unique solution-centered, user-defined workflows offer an intuitive approach to investigate and resolve performance problems. The newly designed web-based user interface (UI) features pre-built widgets to get you up and running fast. Get the performance management metrics you seek with the easy widget creation tool that facilitates the sharing of data with other business units.

Performance Reporting

Apex offers a top-down approach that combines enterprise-wide views, macro and micro-level reporting, and deep drilldown for better problem resolution. With its intuitive UI, Apex serves as a performance management hub, combining packet-based analytics and metrics like flow-based data and status – giving you an overall view of network, system, application, and infrastructure health.

Borderless Service Collaboration

Third-party integration and multi-domain reporting are facilitated via RESTful API. Integrate your performance management solutions now for ultimate visibility. Share and manage performance data with complementary IT initiatives like event management or service orchestration. All configuration, management, and data can be accessed, controlled, or modified externally in an automated fashion.

Application and Transaction Intelligence

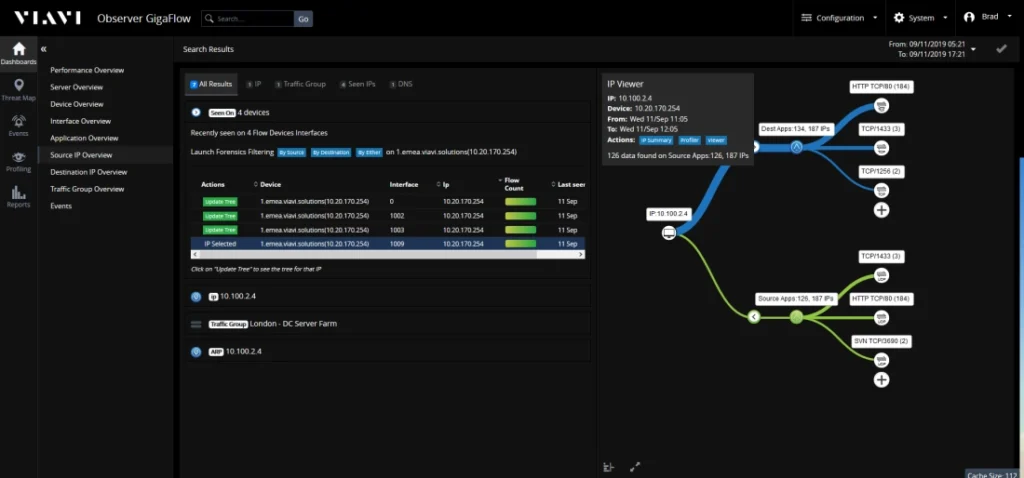
Apex offers application dependency mapping (ADM), which automates discovery of app interdependencies, building maps that visualize these complex relationships with simplified clarity. It provides critical information for locating issues and migrating applications to new environments. Improved transaction reporting and enhanced end-user web visibility are also functionalities of Apex.

Behavioral Analysis & Baselining

Use Apex advanced behavioral analysis and baselining to establish benchmarks for any performance or time-based metric. This includes application response time, VoIP, MOS values, or network utilization. Apex leverages advanced heuristics to quantify the unique behavioral characteristics of your environment, enabling you to quickly determine if application delivery and performance is acceptable based on your network’s distinct traffic patterns or compare performance from different periods of time.

For example, compare application performance for every Wednesday for the last six weeks, or the 15th of every month for the last three months. Set alarms to be immediately alerted when performance metrics have reached marginal or critical thresholds so network teams can tackle issues before they impact the user. Once optimal baselines are established, lock baselines to eliminate issues of drift.

Observer Platform Integration

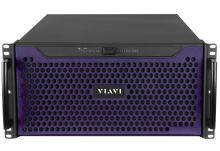
Observer Apex is a stand-alone appliance that simultaneously collects and aggregates data from Observer GigaStor, Observer Probes, NetFlow devices, and other collection agents.

Apex fully integrates high-level monitoring with detailed problem-solving capabilities on a single platform. Combine Apex with multiple Observer Analyzer, Observer GigaStor and Observer Infrastructure (OI) installations to gain long-term aggregated views of network activities and to correlate network, application and infrastructure performance.

Beyond providing an easy-to-access view of network performance, reports can be segmented by individual business units, user groups, or infrastructure types. This means you can quickly view bandwidth utilization or application use by department.

Network Instrument Observer Apex

How is Observer Apex Deployed?

As a key component of the Observer Performance Management Platform, Apex collects metadata from multiple devices deployed across the network, including Analyzers (Expert Edition and Suite), GigaStor appliances, Probes, and Observer Infrastructure. The data is aggregated and analyzed to provide integrated views of network, application, and device health across the entire organization.

Deployment Considerations:

  • Install all Probes or Analyzers on systems with a static IP address.
  • Deploy Apex in a central location within reach of Analyzers, GigaStors, and Probes on your network. Analyzers, and Probe locations will depend on network size, configuration, and visibility requirements.
  • Utilize redundant Apex capabilities with two duplicate Apex systems; a primary and a secondary for automated replication, facilitating redundancy.
  • Server configuration is straightforward as Apex has its own web server, which starts automatically when the system boots.

What's New?

Intuitive User Interface

The newly designed, intuitive user interface (UI) takes ease-of-use to the next level, facilitating better configuration, management, and reporting. The modern HTML5 UI gives you visual representations of the data you seek in a number of different formats. Use the pre-built dashboards and reports, or create your own with metrics that matter most to your organization. Share findings with other business units in the form of reports and dashboards that are digestible and easy to understand.

Expanded Workflows & Analysis

Greater access to transaction-level detail improves network team knowledge of applications. By restructuring the way data is organized and presented, it’s easier to visualize the flow and execution of the various application tiers as users consume IT services.

Enhanced Web Service Analytics

When it comes to how effectively your web-based apps and services are running, the customer is always right. For complete service assurance, you need the fine-grained, end-user operating parameters that the Observer Platform can provide. From client device response time to browser type, and even operating system (OS), get granular views into actual systems and applications. HTTP traffic metrics include details on browser type and OS, as well as the ability to correlate this information with response times, errors, and more.

Third-Party Integration

A RESTful API enables the easy sharing and management of performance data with complementary IT initiatives like event management or service orchestration. All configuration, management, and data within Observer Apex can be accessed, controlled, or modified externally in an automated fashion. This functionality facilitates the sharing of data and performance intelligence with other groups or workflows, and brings all of your performance management tools together.

Automatic Updates

Check for, download, and install Observer Apex patches and version updates quickly and easily from within the product interface. Product updates and installations can also be scheduled when it’s convenient for you. Automatic updates saves time and allows you to access all new features and functions as they become available.

Technical Specifications

Observer Apex can be deployed as a stand-alone hardware unit, in combination with Observer Analyzer Suite, or as part of a larger Observer Performance Management Platform deployment.

Apex Hardware Appliance:
Network Instruments Observer Apex

  • Compact, fault tolerant 2U form-factor

Dimensions:

  • 19 in (W) x 3.48 in (H) x 26.01 in
  • (mounting depth)
  • (Full depth with handles: 28 in) 48.3 cm (W) x 8.8 cm (H) x 66.1 cm
  • (mounting depth)
  • (Full depth with handles: 71.1 cm)

Weight:

  • 62 lbs (28 kg) / mounting rails: 9 lbs (4.1 kg)

Power Consumption (Full load):

  • Input Voltage: 100V-240V auto select
  • Input Frequency: 50/60Hz
  • 258W (880 Btu/h)

Lights Out Capability

  • Manage, monitor and control the probe remotely through an intuitive web-based IPMI (Intelligent Platform Management Interface) v2.0 port.

System Requirements

As with any network analysis product, more RAM and faster processors improve performance. Network Instruments does not support configurations with less than the minimum stated requirements.

Minimum system requirements

  • Quad-core Processor w/ clock speed of 3.0Ghz
  • 32GB Memory
  • 4-disk RAID 5 array, 1TB disks, 7200RPM disks

Contact Us

Address:

Telnet Networks Inc.
4145 North Service Rd. Suite 200
Burlington, ON  L7L 6A3
Canada

Phone:

(800) 561-4019

Fax:

613-498-0075

For More Information about Telnet Networks, our products, or our services, or to request a quote please feel free to contact us directly.