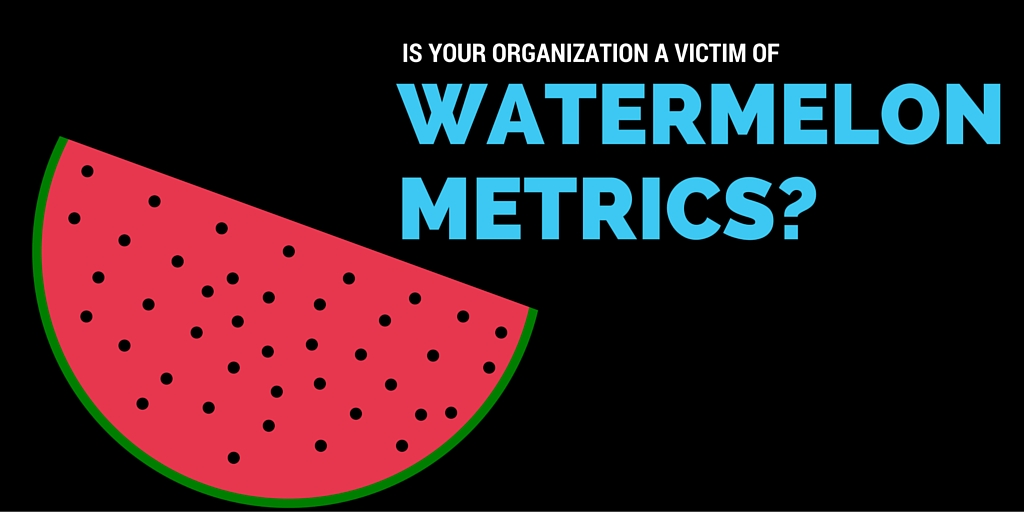
Watermelons are beautifully green on the outside. But if you had never seen one before, you might be deceived into thinking the whole fruit is the same color. It wouldn’t be until you cut it open that you’d come to find the inside is a deep, juicy red.
Even though it may sound odd, watermelons are a fitting analogy for metrics in the IT world. It’s easy to get a false sense of comfort by glancing at your dashboard. It often presents a large number of indicators that give off a welcoming green glow. But if you just dig a bit deeper, you’ll come to realize users are experiencing issues of which you weren’t even aware. Just like with the watermelon, you’ll be deceived until you discover the underlying sea of red.
 Unlike the obvious red insides of a watermelon, however, pinpointing the red spots in your network might be difficult. This challenge arises simply because you’re dealing with a huge amount of data. In a large environment, you may regularly see 98.5% to 99% availability. That’s a good threshold as long as the failures are evenly distributed across your entire user base.
The problem occurs when those failures are concentrated on a small group of individuals. It could be a particular location, characteristic, or combination of system attributes that causes a small subset of users to experience nearly 100% failure rates. In aggregated view, the 1.5% overall failure rate isn’t meeting the threshold to trigger a red light.
How can you prevent yourself from becoming a victim of watermelon metrics? It comes down to measuring customer experience by looking across a large number of users. If you were only relying on your dashboard, you’d definitely be in trouble. You need to have a system in place that’s smart enough to pick the outliers. It needs to be able to detect failures that are concentrated so that a small group of users is seeing a significant impact. The goal isn’t just to understand the total level of errors, but to figure out how those errors group together. Is a specific subset of systems and individuals being affected?
Another mistake that all too many organizations make is to build dashboards that look at each individual system separately. They may have a dashboard full of green because each system is operating within acceptable parameters. Especially in unified communications, the reality is that the solution itself is not an individual system. It’s an entire ecosystem of solutions working together interoperably. The interoperation of those solutions is actually what delivers the customer experience.
Underneath the dashboard’s green facade could be an issue where the interconnection between the systems isn’t working properly. The resulting user experience may be a caller that reaches a contact center agent who has to ask for account credentials because the information isn’t automatically populating the screen. The caller might also end up at a dead end in the IVR system. Even worse, the call may not even go through at all.
It’s ultimately a question of being able to find the underlying connections on which the user experience depends. A system that uses artificial intelligence and correlation will be able to understand how to group the data and look at it dynamically to identify any issues or abnormalities. The mathematical discipline called anomaly detection is an entire science in itself, and allows the pinpointing of issues that would otherwise be hidden within normal distributions and thresholds.
UC management systems should look at the ecosystem holistically, examining the critical interactions between systems. That’s how you break the watermelon open and identify hidden red areas in the form of interdependency and interoperability. Ultimately, looking at the totality of the customer experience is possible.
You can think of a UC system as both a horizontal and vertical arrangement. Horizontally, it’s a collection of several solutions working together in tandem. Vertically, it’s a multilayer technology stack that depends on interconnections. Instead of looking at how all those individual elements are performing, you need a bird’s-eye view of how well they’re performing together.
You’d essentially be trying to find a needle in a haystack if you were looking for an issue in a single system. In this case, you actually have several fields that are each filled with many haystacks. Whenever a problem arises, you don’t even know which field to look in, let alone which haystack to search for the needle. A holistic solution will tell you exactly in which field and which haystack the needle is located. From there, it’ll also help you to pinpoint that elusive needle.
Thank you to Darc Ramussen CEO and Managing Director of IR for this post.


