Learn the concepts and technologies behind effectively managing application performance, so you can identify and correct issues before they affect your business.
Application Performance Monitoring Technologies
There are a number of different types of tools on the market that report on application performance. They can be roughly categorized by the mechanisms the tool uses to measure performance:
- Synthetic transaction systems generate test transactions from one or more clients (or pseudo-clients) on the network, and measure how long it takes the server to respond. These can be custom scripts developed in-house, or purchased as configurable tools aimed at particular applications.
Superficially, this type of monitoring is the most straightforward to understand and deploy. The reality is that these types of systems do not accurately mimic actual client behavior without a lot of up-front development and ongoing maintenance of the scripts. They also put extra load on network and server resources, potentially degrading the performance of actual transactions.
- Instrumented application monitoring systems have entry points built into the server to facilitate transaction monitoring. Depending on the application and instrumentation method, the entry points can be hard-coded into the application, or activated at run-time via software libraries provided by the application vendor. The Application Response Measurement-Application Programming Interface (ARM-API) specification is an open source implementation of this technology supported by major application vendors such as Oracle and SAP. SNMP can be set up with an Application Response Time (ART) MIB agent acting as an application instrument.
These types of systems can produce very detailed information. This level of detail can be quite useful to application developers, but is usually overkill for day-to-day performance monitoring and troubleshooting. Another disadvantage is that the instrumentation consumes application server CPU time and disk space, potentially compromising the performance that you are trying to measure. Moreover, these types of tools can only monitor applications or platforms that provide internal instrumentation. And finally, steep license fees and configuration complexity make application instrumentation the most expensive solution to purchase, deploy, and maintain.
- Instrumented client monitoring systems provide a view of application performance obtained from agents or APIs deployed on client desktops.
As with application instrumentation, this method can produce an avalanche of data that is of questionable value for routine performance monitoring and troubleshooting. Client instrumentation also consumes desktop resources, and generates additional traffic on the network whenever the clients report to a central management console. Moreover, you can only monitor the performance as experienced by the clients that are instrumented.
- Application-aware network analyzers passively “eavesdrop” on live communications between servers and their clients. By decoding network and application-layer protocols, they can parse out client/server communications to determine transaction volume, response times, and error rates.
Although the aggregate information provided by a network analyzer can be slightly less granular than the detailed breakdowns provided by instrumented clients and servers, a network analyzer can show you exactly what is happening on the wire with individual transactions. Unlike instrumented systems and synthetic transaction generators, an analyzer leaves no footprint on production systems. In all cases, a network analyzer is the only tool that can examine individual transactions and client/server conversations in detail, and on all the OSI model layers. And finally, a network analyzer (even one with expert application analysis features) is a fraction of the cost of most dedicated application analysis tools.
Synthetic transaction generators and dedicated instrumentation have their place, especially during application development, prototyping, and initial rollout. But to prevent and solve problems on the ground, a network analyzer with expert application analysis is necessary, even if you have deployed the most expensive, high-end, dedicated application performance management suite. And because of its inherent versatility, a good protocol analyzer may be the only tool required for many organizations.
Beware of network analyzers that merely claim to perform application analysis; some vendors stretch the definition of TCP stream analysis. For application analysis to give you a useful picture of what is really happening, the analyzer needs to “speak” the application’s native tongue. TCP stream analysis is like listening in on a conversation carried on in a language that you do not understand: you know the parties are having a conversation and are responding to each other, but you cannot tell whether any actual or useful information is being exchanged.
If the analyzer claims the ability to “customize” its awareness of applications by merely providing a TCP port number, there’s a good chance that it is only performing TCP stream analysis rather than true application analysis.
Network Instruments’ Observer® Expert (the product used in the examples below) performs true application analysis by having the intelligence to analyze all seven OSI layers for the applications supported, which include SQL, MS-Exchange, POP3, SMTP, Oracle, Citrix, HTTP, FTP, and many more.
Deploying and using a network analyzer for application analysis
The following sections illustrate how to set up and use an all-purpose analyzer to perform application analysis in a typical enterprise. Although your applications and network may differ in particulars, the examples illustrate some key concepts applicable to any enterprise network. These include how to deploy probes for best visibility, and how application analysis plus the drill-down capability provided by a mature network analyzer can solve real-world application performance problems.
Probe deployment for application visibility
Most all-purpose network analyzers are distributed, allowing a single console to monitor multiple switch segments through the use of probes. Deciding where to place probes for application visibility in such an environment requires some thought.
A probe can only “see” the traffic that passes through the network segment where the probe resides. And because probes perform the timestamping function that makes analysis possible, the location of the probe can have some affect on response time analysis results.
If you place the probes at the edge of the network (for example, by monitoring SPAN sessions obtained from switches at the edge), you may get a more accurate reading of delay as experienced by users, but you will need a lot of probes to monitor all of the transactions occurring across a multi-segment network.
By placing probes closer to the application servers (for example, by monitoring a SPAN session of the server ports on the core switch), you can see all of the transactions with fewer probes. While this may mask how clients experience delay by a miniscule amount, you will nevertheless be able to determine changes in delay, thereby spotting trends (which is the main reason for continuous monitoring).

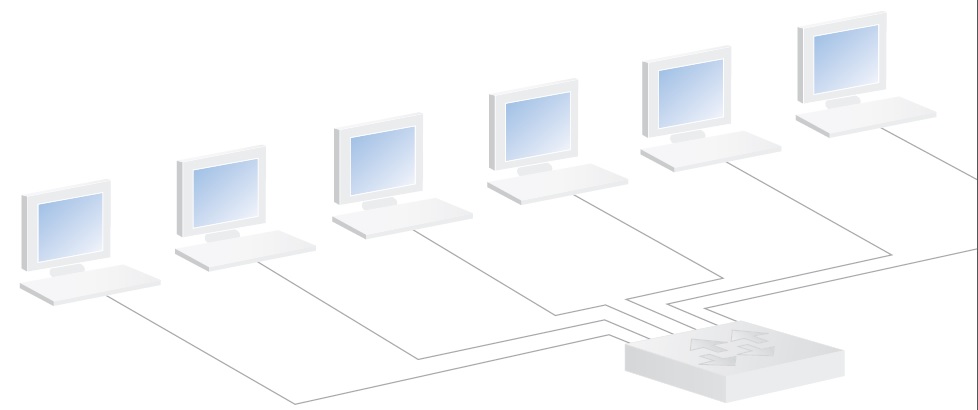
XYZ, Inc., has a number of different servers attached to its core switch. Customer records and order processing depend on two SQL servers connected to the core switch, D1 and D2. The performance of these servers is monitored continuously by a Network Instruments® 10/100/1000 Probe Appliance via a SPAN session configured on the core switch that mirrors all traffic flowing to and from D1 and D2. With this setup, the administrator can track every single transaction, no matter where the client resides.
Application Response Time: What does it measure?
The most comprehensive and correct definition of application response time answers the question: “How long did it take to fulfill the client’s request?” Using SQL as an example, true application response time measures how long it took the server to deliver every last bit of data requested by a client’s SELECT request, down to the last data frame.
Some tools merely measure TCP handshake completion time or TCP ACK response time and call this “application response time.” While these TCP metrics are useful in showing you TCP performance, they reveal nothing about problems your users could be having at the application level. If Layer 4 is all that is being analyzed, you won’t see any of the delay or failed transactions caused by server problems.
Calculating true application response time requires that the analysis tool have some hard-coded knowledge of the application being monitored and how its clients and servers communicate. For this reason, it is typically available for a limited number of common applications, such as SQL, HTTP, FTP, etc. If an analysis tool claims to measure application response times for any and all custom applications, what it really shows is probably some form of TCP response time.

Continuous monitoring and long-term trend analysis
Continuous monitoring and long-term trend analysis are crucial for efficiently managing application service delivery. When you know how your servers and your network behave when things are “normal,” you will become better at diagnosing the complaints that inevitably arise.
Jay, the IT administrator at corporate, has been using Observer Expert’s Network Trending feature to track SQL application performance for a number of months. He knows from experience that average application response time for the SQL servers doesn’t often go above 60 milliseconds. Even though users hardly notice when response times exceed this level, it could mean trouble down the road. So in addition to running network trending, Jay is in the habit of glancing at Observer’s real-time application analysis response time chart.
One morning, Jay starts up application analysis and sees the following response time analysis charts:

The bottom chart (D2, the order processing database) shows a server in good shape. Transaction volume and response times are stable and within usual limits. The top chart, however (D1, the CRM database) shows trouble. Although transaction volume is flat, response times have been creeping up all morning. If the trend continues, the server could come to a standstill. Because Observer is a full-featured network analyzer, it was easy for Jay to eliminate viral infection or hacker attack as possibilities by using Observer’s other diagnostic tools. Examining the server process table revealed a memory leak on the DB1 server. Jay restarted the system to solve the immediate problem, and later found a patch for the SQL server to fix the memory leak itself.
Troubleshooting application performance problems
Sometimes the greatest value in application analysis is in quickly eliminating the application server as the source of a problem. When the application isn’t the problem, a network analyzer provides immediate and intuitive drilldown to whatever piece of the diagnostic puzzle you need to solve the problem at hand.
For example, one afternoon Jay received a call from Pat in sales complaining that the network must be down because her desktop client software couldn’t complete an order.
The application analysis charts showed that both servers were behaving normally. Observer’s Network Vital Signs showed nothing unusual happening on the network other than moderately high levels of traffic compared with the baseline. Jay decided to drill down to examine the client side. By directing a SPAN session to his console, Jay could see all traffic to and from the client. Observer’s Top Talkers display shows that Pat’s workstation is generating suspicious levels of traffic. Using Observer’s virus and hack signature filters, Jay is able to diagnose the problem as a viral infection, which is not only slowing down the client workstation, but affecting network performance for everyone connected to that switch.
Expert analysis tools useful for examining application issues
Application performance problems are some of the most complex tangles faced by administrators, both technically and politically. In-depth, accurate analysis of what is actually occurring on the wire can be crucial to efficiently solving a problem. But merely decoding packets isn’t enough. What should you look for in an analyzer that will be used in support of your business-critical application servers?
Application-aware server performance tracking:
As shown in the previous section on continuous monitoring, this type of functionality is useful for providing baseline performance measurement, but it can also show many more application-specific details occurring on your network, such as error counts, types of transactions, failed transactions, etc.
![]()
TCP stream analysis and reconstruction:
The ability to view traffic by TCP streams and to reconstruct those streams lets you browse through the sequence of requests and responses, and quickly jump to any files, tables, or e-mails that were transferred. For example, if users are complaining about broken image links on a corporate intranet page, and HTTP application analysis shows internal server errors, looking at the stream of GET requests and responses (and viewing any files that were transferred) can often shed light on the problem.

Connection Dynamics:
Application analysis excels at telling you whether the server is performing normally and giving you an overall picture of response times. Finding the causes of problems, however, usually goes beyond the scope of pure application server analysis. By drilling down to a step-by-step diagram of the conversation between a client and server, you can often identify the precise point in the transaction that is problematic. This can be especially useful in applications such as VoIP that depend on more than one TCP connection. For example, if VoIP application analysis is showing that call setup times are increasing, the connection dynamics display will show whether clients are causing the problem, or the call manager, or the network:

MultiHop Analysis:
As noted, application analysis is focused (not surprisingly) on the application. When application analysis and other measurement tools point to the network as the problem (in other words, the server itself is performing adequately but overall response times are still unacceptable), isolating the delay to a particular router hop often leads to the solution. MultiHop Analysis shows you exactly where the delay is occurring, allowing you to take corrective action.

Retrospective Network Analysis (RNA)
A major factor hindering efficient problem resolution is the often-sporadic nature of application issues. For example, while it may be known that certain users are experiencing poor VoIP call quality, the root cause is not always so apparent. What typically follows is an attempt, sometimes prolonged, to catch the problem as it happens or to recreate it.
As its name implies, Retrospective Network Analysis allows network administrators to bypass the time-intensive step of problem recreation, by simply rewinding through data to the time the issue occurred. The Network Instruments GigaStor™ captures up to 48 TB of data for later troubleshooting and analysis.
In the scenario above, the administrator knows that though some link usage has been periodically high, overall network usage is within the norm. But since an RNA device is present on the network, the admin can simply go back and view the problem as it happened.
The admin locates the general time frame, drills into the individual user detail, then observes the call attempt. Expert Analysis then provides insight into the issue. In this case, somebody had incorrectly configured the precedence level. This is just one example of how RNA can shave hours, even days, from troubleshooting time.
Summary/Conclusion
Applications are the primary reason organizations invest in networks. A key factor in ensuring application availability and performance is having the tools to accurately and continuously measure network performance and application performance. The market is saturated with a wide range of options. But whether you choose to deploy an expensive, dedicated application performance management framework, go with instrumented clients, or forgo dedicated solutions altogether, a full-featured network analyzer with application analysis tools is a must-have item for effectively managing application performance. This is because an analyzer is a do-it-all network diagnostic tool that lets you efficiently drill down to the causes of application performance problems and failures.
Thanks to Network Instruments for the article.
