Much of the discussion around the Observer Platform 17 release has focused on how the designs of the new user interface (UI) and other enhancements will assist network and operations teams to more easily manage service and application performance.
This performance data and analysis isn’t just of value to IT but to the overall business. The challenge for performance management solutions has been providing this intelligence in a way that can be easily accessed and understood by other IT and business teams. The Observer Platform 17 both expands useful analysis available to business groups and makes it easier to use the data with systems familiar to these groups.
Enhancement: Expanding Web Service Analytics
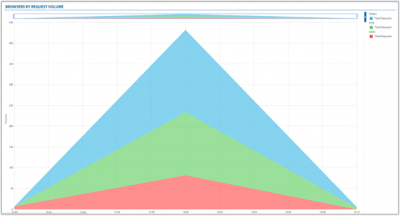
- Benefit: Strengthens visibility into how users consume company web resources, specifically as it relates to a web-based app’s device parameters like OS, mobile and desktop platform details, and browser type.
- Business Value: Knowing not just “what” but “how” customers are accessing data is pivotal to optimizing web content and quantifying the effectiveness of customer-facing web interactions.
- In Practice Example: For the marketing team launching web initiatives, these metrics provide details on how visitors are accessing the website, and enhance their understanding of the user experience by providing response-time and error metrics. Additionally, when network-based problems occur that impact marketing web programs, they can be resolved by the network team which has access to the packets.

Enhancement: Third-Party System Integration via RESTful APIs
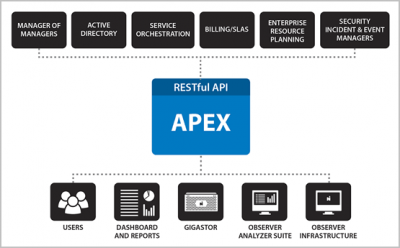
- Benefit: Simplifies sharing of performance data with other groups. RESTful APIs are a programming interface that utilizes HTTP requests like GET, PUT, POST and DELETE. Using this universal access method enables any solution to connect to the Observer Platform to access data or even manage the solution remotely.
- Business Value: Other teams in an organization can interact and view performance data and analysis from the Observer Platform from the tools and workflows that they use on a daily basis. This allows them to proactively track performance of critical business systems, and view these metrics alongside business metrics.
- In Practice Example: A support staff for a retail chain could integrate the Observer Platform into their helpdesk system via Apex’s RESTful API to monitor points of sale (PoS) on their network. The Observer Platform could instantly alert the service desk of an anomaly or system condition that could soon negatively impact users. The early alerts, performance analysis, and access to packets allow the staff to take proactive steps to remediate the issue before it impacts the PoS and customers.

With IT playing a key role in helping businesses to develop competitive advantages and nimbly respond to changing markets, it’s critical that network teams can facilitate the sharing of performance intelligence. This also allows IT and business teams to evaluate the success of business operations and initiatives. The new features of the Observer Platform 17 mark a significant step forward in enabling the network team and IT to more closely align with business processes and goals.
Thanks to Network Instruments for the article.


