A couple of weeks ago, I wrote a blog on how to use a network lifecycle approach to improve your network security. I wanted to come back and revisit this as I’ve had a few people ask me why the visibility architecture is so important. They had (incorrectly, IMO) been told by others to just focus on the security architecture and everything else would work out fine.
The reason you need a visibility architecture in place is because if you are attacked, or breached, how will you know? During a DDoS attack you will most likely know because of website performance problems, but most for most of the other attacks how will you know?
This is actually a common problem. The 2014 Trustwave Global Security Report stated that 71% of compromised victims did not detect the breach themselves—they had no idea and attack had happened. The report also went on to say that the median number of days from initial intrusion to detection was 87! So most companies never detected the breach on their own (they had to be told by law enforcement, a supplier, customer, or someone else), and it took almost 3 months after the breach for that notification to happen. This doesn’t sound like the optimum way to handle network security to me.
The second benefit of a visibility architecture is faster remediation once you discover that you have been breached. In fact, some Ixia customers have seen an up to 80% reduction in their mean time to repair performance due to implementing a proper visibility architecture. If you can’t see the threat, how are you going to respond to it?
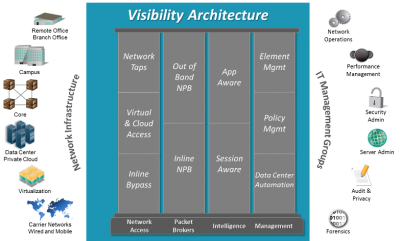
A visibility architecture is the way to solve these problems. Once you combine the security architecture with the visibility architecture, you equip yourself with the necessary tools to properly visualize and diagnose the problems on your network. But what is a visibility architecture? It’s a set of components and practices that allow you to “see” and understand what is happening in your network.
The basis of a visibility architecture starts with creating a plan. Instead of just adding components as you need them at sporadic intervals (i.e., crisis points), step back and take a larger view of where you are and what you want to achieve. This one simple act will save you time, money and energy in the long run.

The actual architecture starts with network access points. These can be either taps or SPAN ports. Taps are traditionally better because they don’t have the time delays, summarized data, duplicated data, and the hackability that are inherent within SPAN ports. However, there is a problem if you try to connect monitoring tools directly to a tap. Those tools become flooded with too much data which overloads them, causing packet loss and CPU overload. It’s basically like drinking from a fire hose for the monitoring tools.
This is where the next level of visibility solutions, network packet brokers, enter the scene. A network packet broker (also called an NPB, packet broker, or monitoring switch) can be extremely useful. These devices filter traffic to send only the right data to the right tool. Packets are filtered at the layer 2 through layer 4 level. Duplicate packets can also be removed and sensitive content stripped before the data is sent to the monitoring tools if that is required as well. This then provides a better solution to improve the efficiency and utility of your monitoring tools.
Access and NPB products form the infrastructure part of the visibility architecture, and focus on layer 2 through 4 of the OSI model. After this are the components that make up the application intelligence layer of a visibility architecture, providing application-aware and session-aware visibility. This capability allows filtering and analysis further up the stack at the application layer, (layer 7). This is only available in certain NPBs. Depending upon your needs, it can be quite useful as you can collect the following information:
- Types of applications running on your network
- Bandwidth each application is consuming
- Geolocation of application usage
- Device types and browsers in use on your network
- Filter data to monitoring tools based upon the application type
These capabilities can give you quick access to information about your network and help to maximize the efficiency of your tools.
These layer 7 application oriented components provide high-value contextual information about what is happening with your network. For example, this type of information can be used to generate the following benefits:
- Maximize the efficiency of current monitoring tools to reduce costs
- Gather rich data about users and applications to offer a better Quality of Experience for users
- Provide fast, easy to use capabilities to spot check for security & performance problems

And then, of course, there are the management components that provide control of the entire visibility architecture: everything from global element management, to policy and configuration management, to data center automation and orchestration management. Engineering flexible management for network components will be a determining factor in how well your network scales.
Visibility is critical to this third stage (the production network) of your network’s security lifecycle that I referred to in my last blog. (You can view a webinar on this topic if you want.) This phase enables the real-time vigilance you will need to keep your network protected.
As part of your visibility architecture plan, you should investigate and be able to answer these three questions.
- Do you want to be proactive and aggressively stop attacks in real-time?
- Do you actually have the personnel and budget to be proactive?
- Do you have a “honey pot” in place to study attacks?
Depending upon those answers, you will have the design of your visibility architecture. As you can see from the list below, there are several different options that can be included in your visibility architecture.
- In-line components
- Out-of-band components
- Physical and virtual data center components
- Layer 7 application filtering
- Packet broker automation
- Monitoring tools
In-line and/or out-of-band security and monitoring components will be your first big decision. Hopefully everybody is familiar with in-line monitoring solutions. In case you aren’t, an in-line (also called bypass) tap is placed in-line in the network to allow access for security and monitoring tools. It should be placed after the firewall but before any equipment. The advantage of this location is that should a threat make it past the firewall, that threat can be immediately diverted or stopped before it has a chance to compromise the network. The tap also needs to have heartbeat capability and the ability to fail closed so that should any problems occur with the device, no data is lost downstream. After the tap, a packet broker can be installed to help traffic to the tools. Some taps have this capability integrated into them. Depending upon your need, you may also want to investigate taps that support High Availability options if the devices are placed into mission critical locations. After that, a device (like an IPS) is inserted into the network.
In-line solutions are great, but they aren’t for everyone. Some IT departments just don’t have enough personnel and capabilities to properly use them. But if you do, these solutions allow you to observe and react to anomalies and problems in real-time. This means you can stop an attack right away or divert it to a honeypot for further study.
The next monitoring solution is an out-of-band configuration. These solutions are located further downstream within the network than the in-line solutions. The main purpose of this type of solution is to capture data post event. Depending whether interfaces are automated or not, it is possible to achieve near real-time capabilities—but they won’t be completely real-time like the in-line solutions are.
Nevertheless, out-of-band solutions have some distinct and useful capabilities. The solutions are typically less risky, less complicated, and less expensive than in-line solutions. Another benefit of this solution is that it gives your monitoring tools more analysis time. Data recorders can capture information and then send that information to forensic, malware and/or log management tools for further analysis.
Do you need to consider monitoring for your virtual environments as well as your physical ones? Virtual taps are an easy way to gain access to vital visibility information in the virtual data center. Once you have the data, you can forward it on to a network packet broker and then on to the proper monitoring tools. The key here is apply “consistent” policies for your virtual and physical environments. This allows for consistent monitoring policies, better troubleshooting of problems, and better trending and performance information.
Other considerations are whether you want to take advantage of automation capabilities, and do you need layer 7 application information? Most monitoring solutions only deliver layer 2 through 4 packet data, so layer 7 data could be very useful (depending upon your needs).
Application intelligence can be a very powerful tool. This tool allows you to actually see application usage on a per-country, per-state, and per-neighborhood basis. This gives you the ability to observe suspicious activities. For instance, maybe an FTP server is sending lots of files from the corporate office to North Korea or Eastern Europe—and you don’t have any operations in those geographies. The application intelligence functionality lets you see this in real time. It won’t solve the problem for you, but it will let you know that the potential issue exists so that you can make the decision as to what you want to do.
Another example is that you can conduct an audit for security policy infractions. For instance, maybe your stated process is for employees to use Outlook for email. You’ve then installed anti-malware software on a server to inspect all incoming attachments before they are passed onto users. With an application intelligence product, you can actually see if users are connecting to other services (maybe Gmail or Dropbox) and downloading files through that application. This practice would bypass your standard process and potentially introduce a security risk to your network. Application intelligence can also help identify compromised devices and malicious botnet activities through Command and Control communications.
Automation capability allows network packet brokers to be automated to initiate functions (e.g., apply filters, add connections to more tools, etc.) in response to external commands. This automation allows a switch/controller to make real-time adjustments to suspicious activities or problems within the data network. The source of the command could be a network management system (NMS), provisioning system, security information and event management (SIEM) tool or some other management tool on your network that interacts with the NPB.
Automation for network monitoring will become critical over the next several years, especially as more of the data center is automated. The reasons for this are plain: how do you monitor your whole network at one time? How do you make it scale? You use automation capabilities to perform this scaling for you and provide near real-time response capabilities for your network security architecture.
Finally, you need to pick the right monitoring tools to support your security and performance needs. This obviously depends the data you need and want to analyze.
The life-cycle view discussed previously provides a cohesive architecture that can maximize the benefits of visibility like the following:
- Decrease MTTR up to 80% with faster analysis of problems
- Monitor your network for performance trends and issues
- Improve network and monitoring tool efficiencies
- Application filtering can save bandwidth and tool processing cycles
- Automation capabilities, which can provide a faster response to anomalies without user administration
- Scale network tools faster
Once you integrate your security and visibility architectures, you will be able to optimize your network in the following ways:
- Better data to analyze security threats
- Better operational response capabilities against attacks
- The application of consistent monitoring and security policies
Remember, the key is that by integrating the two architectures you’ll be able to improve your root cause analysis. This is not just for security problems but all network anomalies and issues that you encounter.
Additional Resources
- Network Life-cycle eBook – How to Secure Your Network Through Its Life Cycle
- Network Life-cycle webinar – Transforming Network Security with a Life-Cycle Approach
- Visibility Architecture Security whitepaper – The Real Secret to Securing Your Network
- Security Architecture whitepaper – How to Maximize IT Investments with Data-Driven Proof of Concept (POC)
- Security solution overview – A Solution to Network Security That Actually Works
- Cyber Range whitepaper – Accelerating the Deployment of the Evolved Cyber Range
Thanks to Ixia for the article.