Fiber Network Taps – Y Cables Matter

Passive fiber optic taps are very simple devices. They almost never go wrong. In fact they have MTBF figures calculated in millions of hours. You will certainly die before they will! However Ixia often gets questions from customers of the kind “I’ve installed your tap, but it does not work – please send me a new one”. In almost all cases this is due to incorrect installation of the tap. In this blog I’ll cover one example of a common error and how to avoid it, but look out for some more blogs on this topic going forward.

1G and 10G Fiber optic TAPs such as Ixia’s Flex TAP have two LC outputs that correspond to traffic flowing through the tap in two directions. 1G/10G Fiber optic links have a duplex pair of fibers and the two outputs correspond to the traffic flowing through the TAP. These are called Left and Right traffic, or DCE and DTE traffic. These two outputs have to be fed to two monitoring ports and two transceivers have to be used to receive the traffic as only the receive side of the transceivers can be used. This creates a challenge as the output from the fiber TAP is a duplex connector and yet two separate connectors are needed to connect to two different transceivers. There are three alternatives:

  • Use 2 separate simplex cables.
  • Use a duplex cable and with a sharp knife split the two ends apart.
  • Use a specialist Y cable

The first two options have a pitfall that sometimes traps operational staff in data centers. The TAP will only work if the cable from the TAP is fed into the receive side of the transceiver. As operational staff are used to usually working with duplex cable and dual fiber transceivers they may not know (or simply make a mistake) and connect to the transmit side of the transceiver in error. In this case not only will the TAP appear not to function, but if the analytic tool is set to allow traffic to be generated on these transceivers, traffic could be injected back into the TAP.

In this scenario a user may think the TAP is not working, when in fact its just been connected up incorrectly.

To avoid this problem its best to use a specialist Y cable that converts a duplex connector to two duplex connectors that are orientated so the light is only fed into the receive side of the transceivers – easier to explain with a diagram! See below for a diagram of an Ixia Y cable for use with its Flex TAP passive fiber TAPs:-

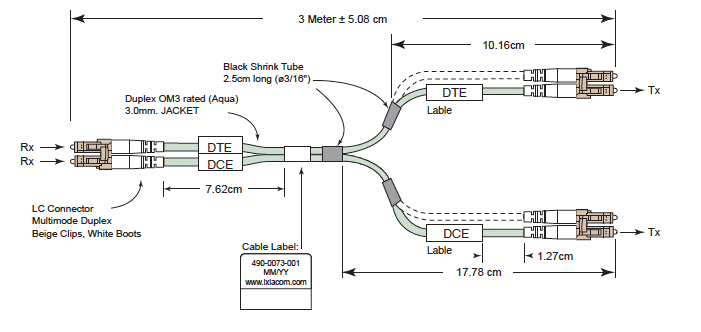
This shows a Y cable that Ixia sells to complement its range of Flex TAPs. As you can see the Y cable is constructed in such a way that the light from the TAP (which is connected on the left hand side of the above diagram) is fed correctly to the two receive ports of the transceivers (which would be on the right hand side). Yes, Ixia makes money out of these, but they are relatively low cost (a list price of less than $100 ea. and they also include two network side cables) and the one time a TAP is connected to the wrong side of a transceiver and hours have to be spent figuring out what is wrong, is the time you come to realize that “Y Cables Matter”.

Discover Application Performance Issues Before Your Business Does!

Availability issues. Slow response times. Performance bottlenecks. Also web applications have problems that affect the satisfaction of your employees and customers. Identify and troubleshoot them before they impact your business with Flowmon APM, an agent-less solution to proactively drive user experience and application value.

 Application Performance Management for IT Operations

 Is your critical web application running smoothly? What if your customers face a slow response of your business application? What if you do not even know that your employees are struggling with errors when working with internal systems? How promptly do you detect an error and the root cause? Flowmon Application Performance Monitor (APM) solution proactively monitors your business critical applications from the end user perspective so you always know how they stack up. With no agents on servers, no changes in configuration.

 With Flowmon APM you can start transparent application monitoring in a matter of minutes. Understand how every application behaves to every user in real-time with analysis of application protocols and communication between application and database servers. Flowmon APM automatically identifies performance problems, reveals root causes and provides IT operations with deep-insight diagnostics to drive user experience and application value. For all the users, for all the transactions for your business.

For more information about this application, click here .

SNMP: The ABCs of Network Visibility

Network management and monitoring is a large topic. It includes device monitoring and management, device cluster monitoring and management,network monitoring and management, application monitoring and management, problem resolution, and elements of network security as well. In this blog, I wanted to focus on device monitoring.

Devices are often referred to as network elements (NEs). They are millions, probably billions, of devices worldwide when you count printers, switches, routers, taps, etc. At this point, I’m not necessarily talking about the Internet of Things (IoT), where there are billions of end user devices that connect “into” the network. The devices I am referring to “are” the network. Each of these devices need to be managed and monitored once they are installed into the network. Simple Network Management Protocol (SNMP) is often the protocol of choice for this endeavor.

What is anSNMP? 

SNMP is a device management protocol first developed by the Internet Engineering Task Force (IETF) in 1988. It uses Internet Protocol (IP) for communication. There are three components to an SNMP-based architecture: the devices being managed, agents, and the controller (called a network management system (NMS)).

SNMP is used to manage all sorts of devices. This includes: routers, switches, hubs, and lots of other IP-based network devices. The NMS communicates to these devices to get information from the device, to set values in the device’s variable list, and to receive asynchronous messages from the agent (often called a “Trap”).

Typical Use Cases 

 Here are some specific situations in which SNMP is particularly useful:

Component monitoring – Gathering basic data from devices like operational state, temperature, specific counts for pertinent data, data reports, etc.

Component management – Pushing new configuration changes to the device, initiating resets, and changing data reporting parameters.

Considerations

While device management and monitoring is important, here are some other things to keep in mind when monitoring your network:

Understand your NMS – Can it be integrated with the rest of your network management activities or will this be a stand-alone island? Using SNMP to control individual devices is important but many vendors have an element management system (EMS) that configures their individual devices. It may or may not us SNMP and there is a good chance it may not expose the SNMP data to your other management systems. This means that you need to be cognizant about how element management systems you will have in your network, what you can and cannot do with each one, and often you need to use each one. The fewer number of systems you interface with will lower costs and lower device management fatigue.

Understand device and NMS interoperability – Besides SNMP, there are other important protocols like REST. Do your devices and NMS system(s) support the REST protocol so that you can automate function and control of devices within your network? This will be very important to controlling management costs.

More Information on Device ManagementMore information about Ixia network performance, network security and network visibility solutions and how they can help generate the insight needed for your business is available here.

Thank you to Keith Bromely of IXIA, a Keysight  Business, for the article.

Twelve applicants for Canadian 600MHz auction

Innovation, Science & Economic Development Canada has published the final list of twelve applicants for the upcoming national mobile frequency auction in the 600MHz band. Alongside the big three nationwide mobile operators Rogers Communications, Bell Mobility (part of Bell Canada) and Telus, the other nine applicants are: Freedom Mobile (owned by Shaw Communications); Quebec-based cableco/cellco Videotron; Saskatchewan incumbent SaskTel; cableco/cellco Eastlink (registered as Bragg Communications); Iristel (registered as Iris Technologies – VoIP provider and parent of far-northern cellco Ice Wireless); Xplornet (Canada’s leading rural fixed-wireless broadband provider, which recently entered the mobile market in Manitoba); SSI Micro (Qiniq – far-northern competitor providing wireless voice and data services); Novus Entertainment (British Columbian fibre triple-play operator, associated with Novus Wireless); and Tbaytel (a local full-service telecoms operator in Thunder Bay, Ontario).

Confirmation of qualified bidders is scheduled for 18 December 2018 and the auction bidding starts 12 March 2019. 70MHz of spectrum in the 614MHz-698MHz range is on offer for mobile, fixed or broadcasting services, with 43% (30MHz) of frequencies set aside for ‘regional competitors’ (i.e. existing cellcos other than Bell, Rogers and Telus) and potential new mobile market entrants. 

Thank you to TeleGeography for the article. 

5% of Your Customer Interactions are Failing!

During a typical month we generate between 500,000 to 600,000 HeartBeat calls, and of these anywhere from 4% to 6% of these calls we encounter availability or performance issue. So, we classified these issues to see where they were coming from:

  • ​40% – Issue with answer – busy, ring-no-answer, silence or click
  • 40% – Caller-requested information unavailable – host issue
  • 20% – Caller disconnected prematurely

So out of 600,000 test calls in a typical month, 12,000 are answered incorrectly, or not at all. Another 12,000 are customers being led on a wild goose chase all the way to the point of finally being able to retrieve the info they need only to find out it wasn’t available. And another 6,000 callers are just getting cut off – they get to start from scratch AGAIN!

​How Does This Affect the Agent?

If the technology required to handle & deliver the calls to the agents fails, when your customers finally do get through they have already been preconditioned with a lousy experience, and who will they take it out on?

How is Your Centre Doing?

Here you are a call center manager,  working hard to keep your people and your customers and your business units all happy. You’re up-selling and cross-selling while cutting costs & keeping attendance high & training agents to deliver the best possible customer experience, and all the while you don’t know if the technology you’re counting on to take care of your customers & offload your agents is doing its job or not.

With HeartBeat, we generate a test call, one at time around the clock to access your system to ensure they are available and more importantly working as they were intended to do, if not then we send an automated notification to alert everyone involved.

Can Flow Monitoring Work on Encrypted Traffic?

Encrypted traffic is on the rise. It’s no longer possible to inspect the content of the communication. What does this mean for network traffic monitoring?

Encrypted traffic is on the rise. In 2016, NSS Labs found out that 97% of surveyed enterprises saw an increase in encrypted web traffic. Both Let’s Encrypt and Google  currently report between 70% and 90% of traffic is HTTPS (HTTP encrypted with SSL/TLS). Google has been pressing for HTTPS for a while now. Back in 2014, they started taking into account whether the website uses HTTPS for page ranking, and in 2017 Google Chrome browser started showing “Not Secure” warning in the address bar when visiting websites without HTTPS. In August 2018, Scott Helme, a Security Researcher, analyzed 1 million most popular websites – over 51% are already using HTTPS. Gartner predicts 80% of traffic will be encrypted in 2019.

What does this all mean for network traffic monitoring?

Using encryption it is no longer possible to inspect the content of the communication. Let’s take a look at the following screenshots from a popular packet capture tool – Wireshark. Let’s visit the website – example.com. At first, without encryption (plain HTTP) – http://example.com. In Wireshark we can dive deep and inspect the HTML code of the website content being transmitted from the server to the client. Anybody can intercept our communication and take a look themselves:

This is especially problematic with online banking, healthcare services and other sensitive online transactions. This is where HTTPS (HTTP with SSL/TLS encryption) comes in. How does it work? First, the client and server agree on the encryption algorithm they are going to use, and then the encrypted data is transmitted. This is a very simplified explanation and I hope more tech savvy readers will forgive me.How will our communication with example.com look like if we use HTTPS? Here is a screenshot from Wireshark when we visit https://example.com:

The contents are now no longer readable. This is sad news for anyone trying to spy on us. They can no longer get our credit card information or other sensitive data. This is why Let’s Encrypt and other organizations push for HTTPS. It makes our online lives more secure.

Now, we can all agree that encryption is great, pat ourselves on the back for spreading the HTTPS gospel and go home, right?

Well, not so fast. What if you need to know what is going on in your network? What are you going to do when there is an issue with the critical business application? Does your network administrator still rely on legacy packet capture solution for troubleshooting and monitoring? What can you do when you can no longer inspect the contents of communication?

Briefly, consider an example of detecting BitTorrent traffic in a network. In the past it was only a matter of checking the TCP port number (the range for a BitTorrent is 6881-6889). However, nowadays client applications tend to randomize port numbers. It was too easy to block the said ports on the firewall. It’s fairly straightforward to perform deep packet inspection (DPI) when packets are unencrypted. Examples of BitTorrent signatures are “GET /announce?info_hash”, “GET / request” and “GET /torrents/”. The DPI engine looks for these strings within the payload, and once found BitTorrent traffic is detected. Unfortunately, most of the client applications encrypt BitTorrent communication by default. Users can disable encryption, but they still accept encrypted traffic from their peers (other BitTorrent clients) and thus reducing the detection success rates.

Luckily, we can leverage flow data to detect BitTorrent traffic. By design, a BitTorrent client makes a lot of connections with peers in a short time interval, peers are located all around the globe and many connections fail because peers are offline. In short, we can detect encrypted BitTorrent communication with flow data as it is based on client behavior rather than the contents of the communication. Learn more about sources of flow data in our previous post Where Do The Flows Come From?.

In summary, with encryption on the rise it no longer makes sense to monitor your network with packet capture solutions. With flows it doesn’t matter whether the content of communication is encrypted or not. We leverage information and metrics from lower network layers, which are not encrypted. Thanks to this approach, our network and security monitoring solution works even on encrypted traffic.

So to answer the question in the title (Can flow monitoring work on encrypted traffic?) – Absolutely!

Thank you to Roman Luks from Flowmon for the article.