So, What is the Customer Perspective of your Contact Centre

Enterprise contact centers are becoming extremely complex, using technology from multiple vendors to meet specific customer requirements. Today, clients are using new media types such as smart phones and tablets to reach out so you need to explore new technologies such as cloud services to consolidate and improve your delivery.

Why Test the Customer Quality of Experience?

When you change or deploy new technology you need to understand the caller’s perspective, from the greeting through to the agents desktop. Testing will do three things for you:

  1. Maximize ROI by reducing your system down time and accelerate payback when deploying new technology
  2. Reduce your Risk, with multiple vendors within our systems. Interoperability issues can occur and can be addressed before deployment
  3. Improve Customer Satisfaction by validating the actual customer experience.

What do You Test For?

  1. Infrastructure – This encompasses everything from the carrier network through to the desktop.  By placing real calls from the outside in, you effectively test your voice gateway, the PBX, SIP trunks, load balancing rules, and the effect Data traffic could have on Voice Quality.   You should be able to understand how many calls per minute the system can connect, how the carrier handles overflow, the number of failed calls, busy signals, and ring no answer, etc.
  2. Self Service Applications – technologies such as speech recognition and IVR are crucial to ensure that calls are handled efficiently.   By testing you can understand if the correct prompts are being heard, if your time to connect is acceptable, if the database lookup performing correctly under load conditions, or simply if the responses correlate correctly to the user input.
  3. CTI Routing –  is the integration between the IVR and external systems working correctly, and is the CTI application receiving the correct data
  4. CRM Integration:  Are the screen POP’s coming on time and are the agents getting the right information, with the right call, at the right time.

With a comprehensive plan you can test connectivity by changing the volume of calls or the mix of calls to simulate your defined and expected real world customer conditions and record accurate results.  Detailed behaviour reports are important to allow you to create actionable tasks that address details of what level of load any failures occur.

StressTest allows you to understand how your systems will react to callers rather than letting your customers react to your system.

Are Agents Necessary for Accurate Network Monitoring?

How does an IT team ensure accurate and complete visibility? Obtaining comprehensive visibility into network performance requires not only looking at the network and application, but digging into infrastructure health and performance. Solutions providing this view typically utilize two different approaches: agent or agentless.

Selecting the best method for your team requires understanding the options and selecting the solution that integrates well with your existing resources. In this article, we will:

  • Define agent and agentless approaches
  • Outline pros and cons for each approach
  • Establish a strategy for cost-effective, scalable performance visibility

Defining Agent and Agentless

Agents are typically proprietary software loaded on to relevant application components, devices, and servers. The question to ask application performance management (APM) vendors is whether their platform requires software to be installed on your critical infrastructure.

If the answer is “yes,” the program you’re loading is most likely an agent, which gathers data and sends it to the console or platform for analysis. Agents can also perform tasks that impact or modify the operation of the device.

If the answer is “no,” the APM platform is likely relying upon polling technologies to acquire device performance and related application information. These solutions are typically referred to as agentless.

Agentless solutions often tap into pre-existing or native agents and reporting capabilities placed on the system or device by the infrastructure manufacturer. Utilizing intelligence from these native agents allows agentless solutions to track performance variables including power, CPU, and memory usage without affecting device performance. Additionally, using polling technologies like SNMP or querying Windows systems through WMI provides nearly limitless information about devices and hosted applications.

Assessing the Pros and Cons

The following chart outlines the benefits and costs of each option

PROS
CONS
Agent
  • Designed to provide critical management specific metrics
  • Uses SSL or other encrypted methods to provide data
  • Typically will auto-update to avoid maintenance overhead
  • Can impact critical infrastructure, consuming device’s CPU, memory, and storage
  • Cannot monitor beyond system on which its installed
  • Time-consuming deployment requires agents for every critical device monitored
  • Every new server requires additional agents be purchased
  • Only tracks conditions and metrics it has been designed to target
  • Cloud vendor may prohibit agents; coverage of multiple VMs can be cost prohibitive
Agentless
  • Tracks performance without impacting devices
  • Immediate device discovery and monitoring, once IP address and credentials provided
  • Scales as fast as new devices can be added
  • Any devices can be monitored with minimal deployment effort, not just critical devices
  • Taps into cloud vendor APIs and mimics user experience via synthetic transactions
  • Data sources may not provide full or relevant data
  • Typically requires pre-existing services and agents to be turned on; may also require changes to firewall
  • On larger networks, polling needs to be spaced out enough to avoid overlapping executions

Establishing Effective Performance Visibility

Ultimately, each team must assess the merits of leveraging proprietary agents versus going agentless. As our discussion has shown, each has strengths and weaknesses. Many vendors now offer significant insight into the underlying health and status of the devices and network by exploiting the wealth of information infrastructure and application developers now incorporate directly into their solutions with native agents. Cloud providers as well are introducing APIs that can be readily supported by agentless solutions. This is an important point as cloud vendors generally forbid the placement of any agents within their environments.

Alternatively, if you have ready access to source code and/or require unique visibility into devices not available from agentless monitoring, then proprietary agents could be a consideration. For select applications, they can offer deep insight into application health at the expense of broad service support.

Finally, whether utilizing proprietary agents or an agentless approach, it is important to note that many solutions also provide packet-based analysis to monitor the flow of applications traversing the network. This integrated monitoring approach yields highly granular detail on the overall health of applications and infrastructure, enabling optimal operational efficiency and reduced MTTR when problems are detected

Timing Calibration of a GNSS Receiver

StableNet Sys Log

GNSS is well-known for its ability to provide a position with sub-meter accuracy. However, it is less well-known that GNSS provides a very convenient way of obtaining nanosecond (or even sub-nanosecond) timing accuracy via a GNSS receiver. Indeed, in addition to the three spatial dimensions, GNSS enables the user to compute the clock bias and the drift of the receiver’s clock with respect to the atomic clock of the GNSS constellations. To perform this properly, it is necessary to first calibrate the GNSS receiver and the RF setup from the antenna to the receiver.

Precisely measuring the accuracy of the 1-PPS signal of a GNSS receiver can be challenging, especially as we are dealing with nanosecond uncertainties. The variability (atmospheric conditions, multipath, etc.) and unpredictability of live-sky signals prevent the manufacturer or the end user from calibrating equipment using these signals. RF circuitry and signal processing algorithms are also very sensitive to each signal’s frequency and modulation. Delays can vary up to several nanoseconds between each GNSS signal, which explains why the time synchronization needs to be assessed for each signal.

As a result, the best way to correctly measure the accuracy of a GNSS receiver is to use a well-calibrated GNSS simulator as a reference. A GNSS simulator allows the user to control every type of atmospheric effect and to reproduce a deterministic and repetitive signal. The simulator can also provide a 1-PPS signal for use as a reference for the device under test (DUT).

However, in this case the challenge is to measure and certify the accuracy of the GNSS simulator. The classical approach to generating simulated signals is to use real-time hardware (such as FPGA) to synthesize each satellite signal (usually described as channels) in intermediate frequency (IF). The drawback of this approach is that each FPGA can only handle a limited number of channels, which therefore requires independently calibrating each cluster of satellites. This calibration process is laborious and a major source of errors.

One of the key advantages of the Orolia’s Skydel GNSS simulator is its ability to use the power of the GPU to generate digitally and in baseband each and every satellite signal (as well as multipath or interferences). With Skydel, all satellite signals on the same frequency band are synthesized together with the same hardware components from baseband to RF signal. Consequently, the Skydel simulator needs to be calibrated only once for the two GNSS bands, and the delay between each satellite signal on the same carrier is perfectly equal to zero.

Finally, the Skydel GNSS simulator has been designed from the start to be synchronized with an external reference clock and to easily synchronize an unlimited number of Skydel instances among themselves (for instance, synchronizing multiple antennae or multiple receivers).

This application note gives an overview of the typical timing configurations provided by the Skydel simulator and explains how the end user can accurately calibrate the simulator with its specific laboratory setup (RF cables, LNA, splitters, etc.).

Timing configurations

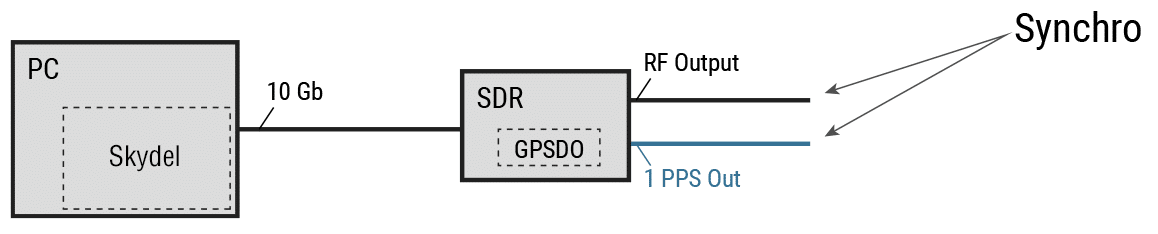
GPSDO Reference clock

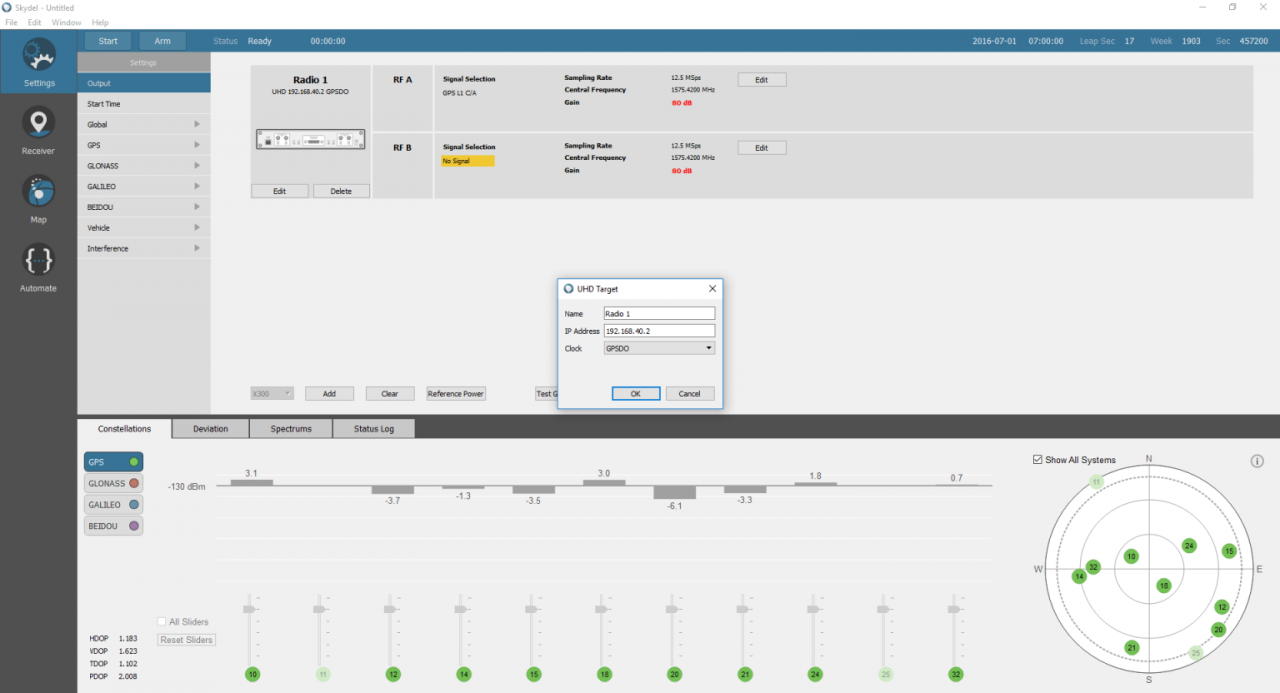
The simplest way to use the Skydel GNSS simulator to calibrate a timing receiver is to set up a basic configuration that uses an Ettus X300 SDR equipped with a GPSDO clock inside. In this case, the GPSDO serves as both a 10 MHz and a 1 PPS reference clock.
For this configuration, we must select GPSDO as a reference clock in the X300 output settings.
With this configuration, the RF signal is synchronized with the 1 PPS output of the X300 radio.

External reference clock – single Skydel session

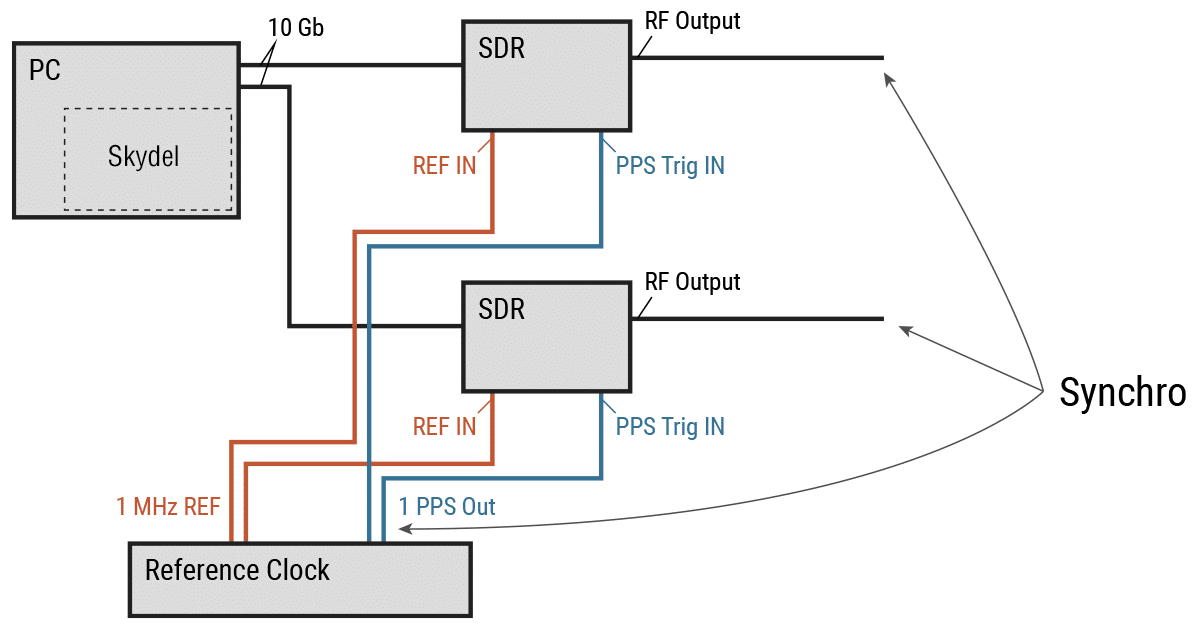
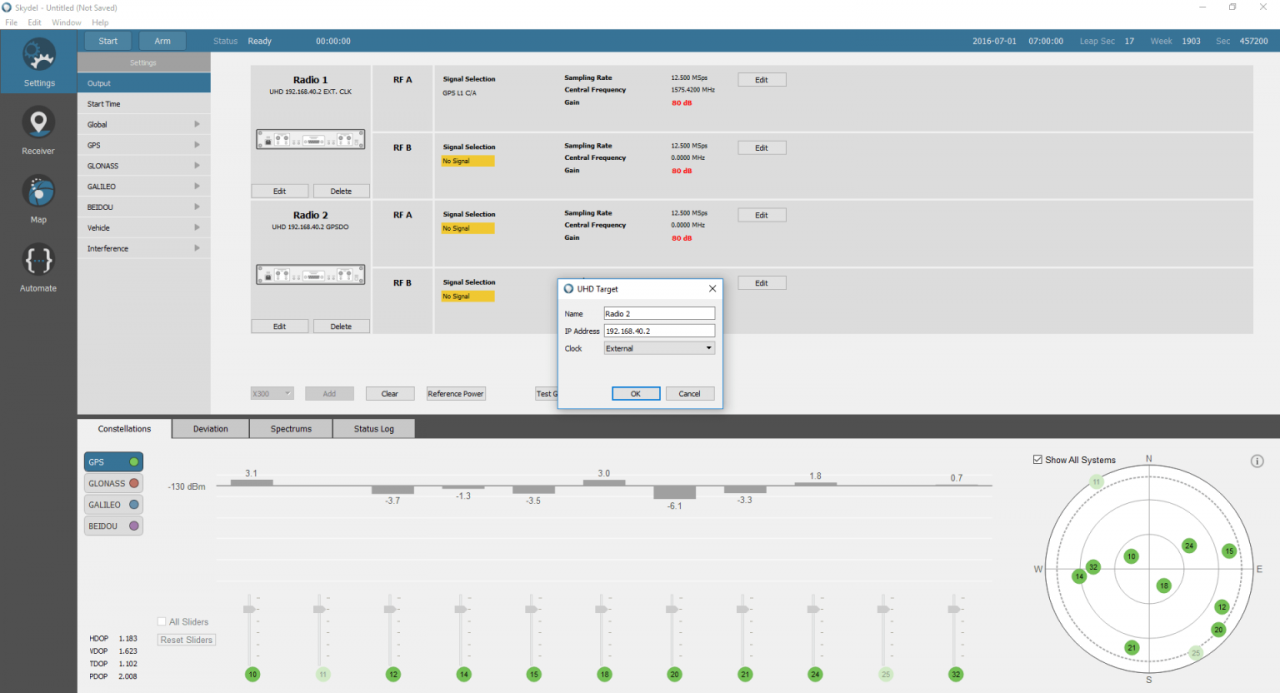
If the user wants to use an external reference clock for the GNSS simulator, it is also possible to synchronize the SDR (or multiple SDRs) with external 10 MHz and 1 PPS references. In this case, connect the 1 PPS input and reference input of each of the X300 SDRs to the corresponding outputs of the external clock. It is important to use strictly identical cables for each of these connections.
For this configuration, we must select External as a reference clock in the X300 settings, doing so for each SDR.
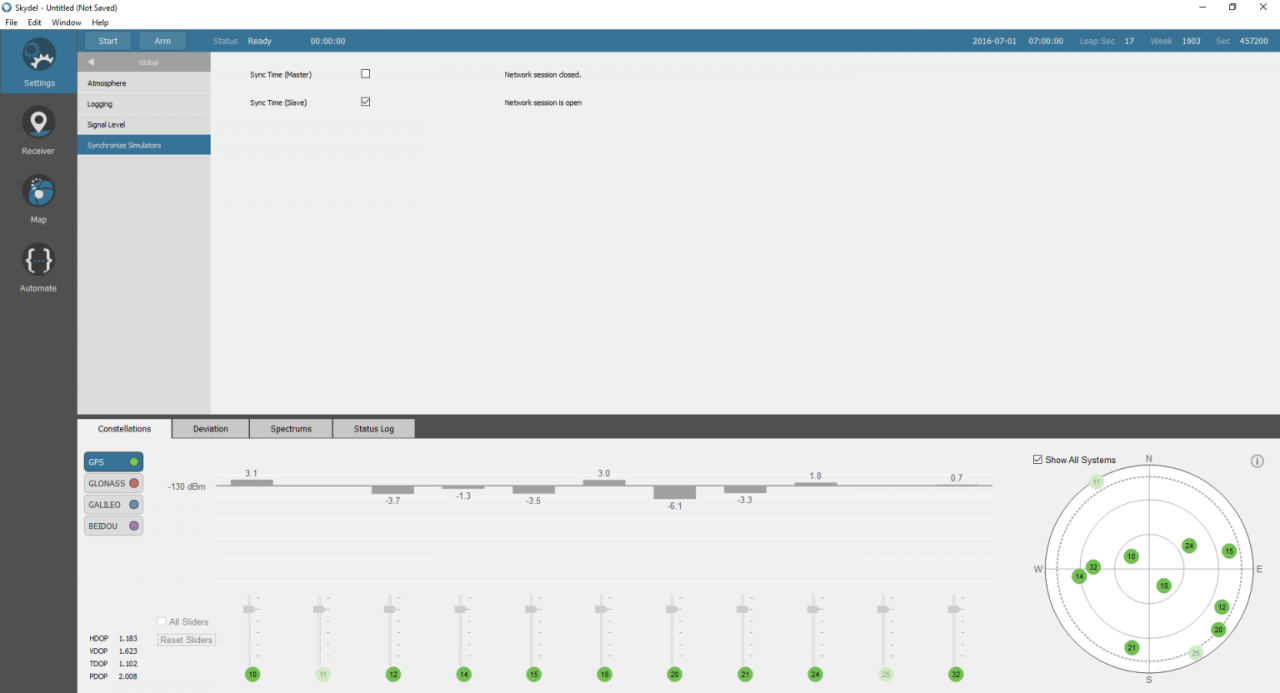
In the Global→ Synchronize simulators settings, we must configure the Skydel simulator as Master.
With this configuration, the RF signal is synchronized with the 1 PPS output of the reference clock. Note that, in this case, the 1 PPS outputs of your SDRs are deactivated as they are not synchronized with any signal.

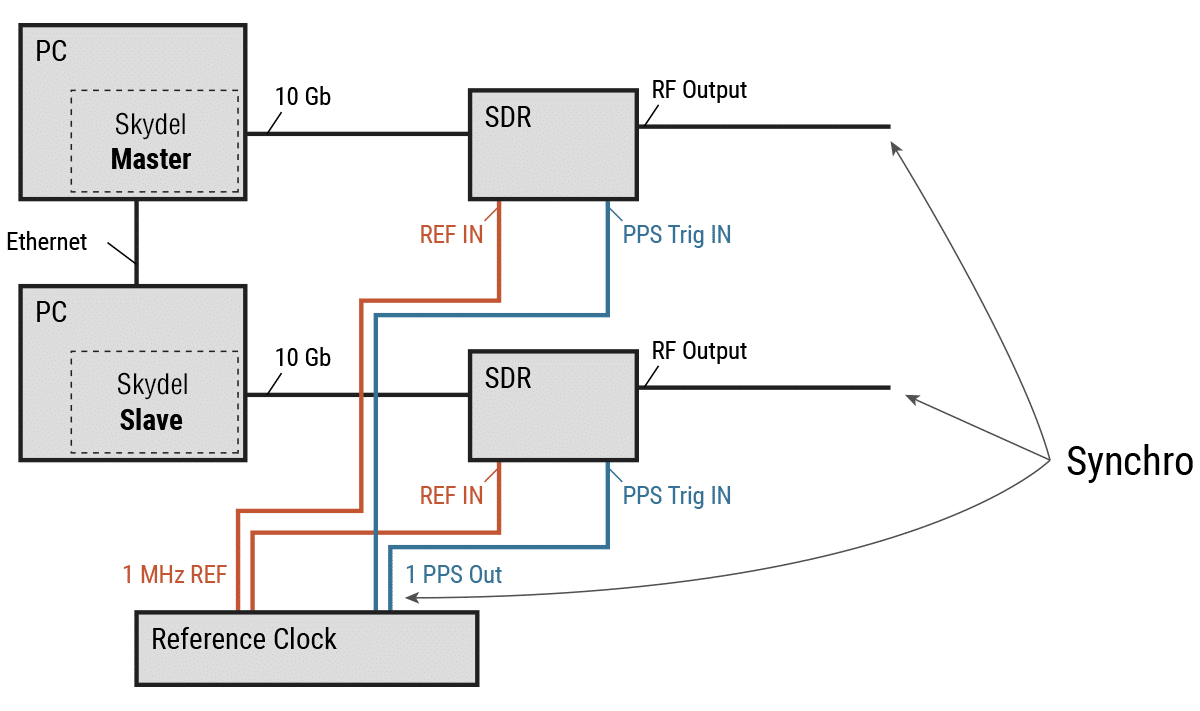
External reference clock – multiple Skydel sessions

Finally, multiple Skydel sessions can be synchronized with one or more SDRs active in each session. The principle is the same as with a single Skydel session—we need to use an external reference clock to synchronize each of the SDR.

For this configuration, we must also select External as a reference clock in the X300 output settings for each SDR. In the Global→ Synchronize simulators settings, we must configure one of the Skydel simulator sessions as Master.

All of the remaining sessions must be configured as Slaves.

Similar to the configuration with a single Skydel instance, the RF signals are synchronized with the 1 PPS output of the reference clock.

Calibration procedure

Configuration Setup

The Skydel simulator is designed to provide a consistent PPS signal with an accuracy equal or better than 5 ns. This calibration is performed for each configuration described in this document and for each sampling rate selected on the SDR output.

However, the user may have a custom installation with RF cables, LNA, attenuators, and splitters between the RF output and the receiver under test. Each of these components adds a supplemental delay to the RF signal propagation that the user may need to evaluate. Furthermore, with good instrumentation, it is possible to achieve far better delay measurement accuracy (e.g., lower than 1 ns).

The procedure required to evaluate supplemental delays with the Skydel simulator with a high degree of precision is as follows:

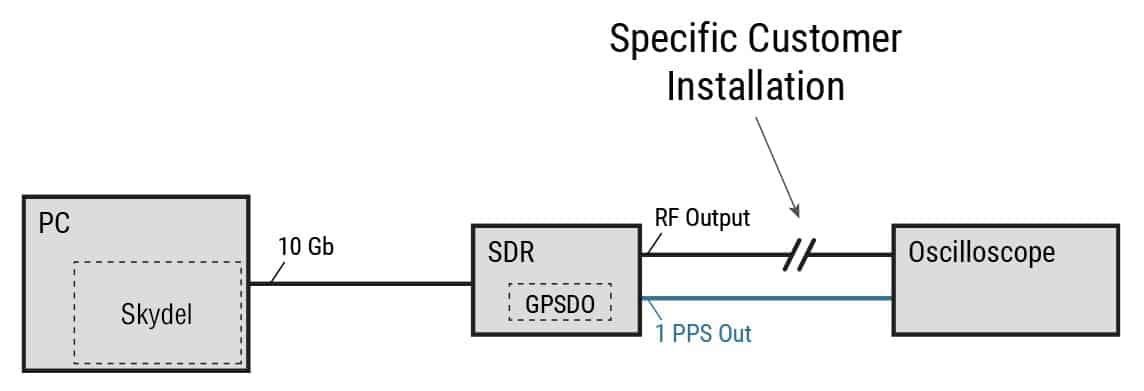
First, the measurement setup requires an oscilloscope connected to both the 1 PPS reference and the RF signal where we need to assess the delay (for instance at the input of the receiver). While the following figure illustrates a configuration with an internal reference clock (GPSDO), it is applicable for the other configurations described in this document (i.e., the 1 PPS reference becomes the 1 PPS output of the external clock).

To measure the delay between the RF signal and the 1 PPS, it is then necessary to create a specific scenario on the Skydel simulator. The simplest way to measure the timing of the RF signal is to broadcast a single GPS C/A satellite signal and to observe the transition between the last chip and the first chip of the modulation code. Thanks to the specific design of the Skydel simulator, each of the other GNSS signals will now be perfectly aligned with the C/A code.

Scenario description

Create a new scenario within Skydel and configure a new radio broadcasting-only GPS C/A signal on the output to be measured. In the Settings panel, select the output bandwidth that will be used to evaluate the timing receiver.

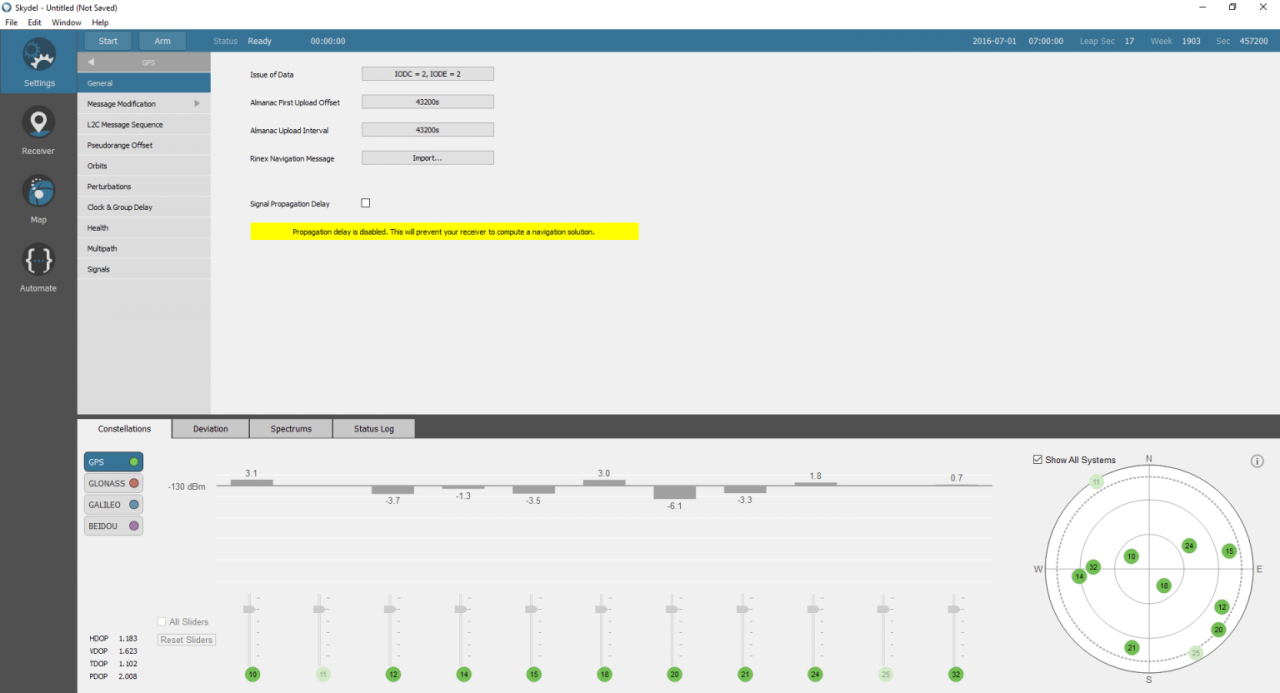
In the GPS→ General tab, uncheck the signal propagation delay option. Skydel will then simulate pseudoranges with a zero delay for each of the satellites, enabling it to accurately align the C/A code with the 1 PPS signal.

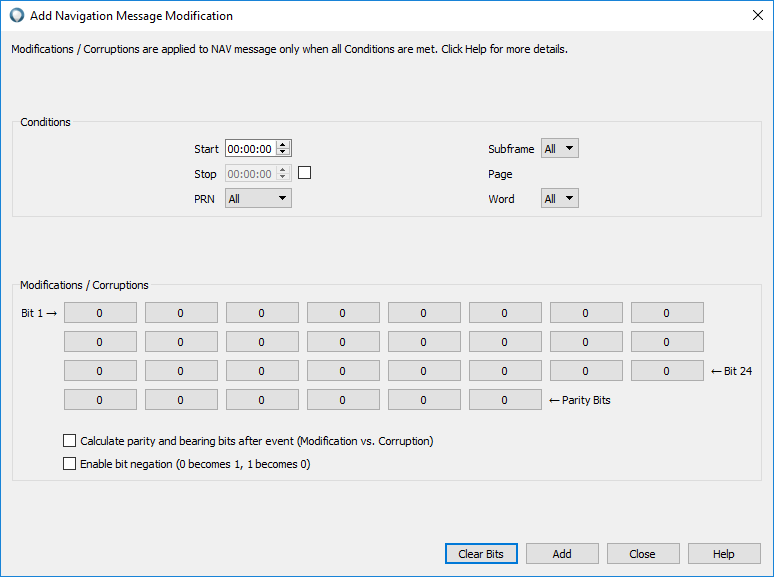
In the Message Modification→ NAV tab, add a new message modification on satellite #10. Set each of the bits to 0 (including parity bits) on all of the subframe as well as the word. With this modification, we are sure to have a 0/1 chip transition at the end of the modulation code (every ms).
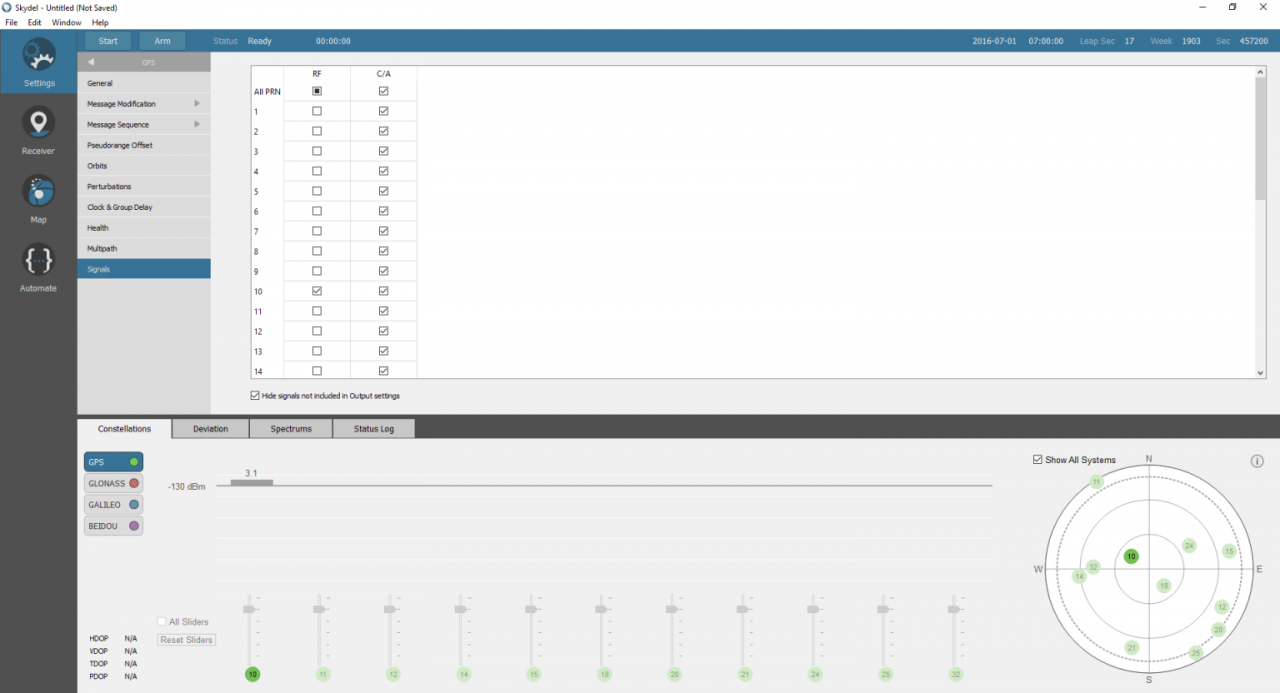
In GPS→ Signals, unselect the RF signal for all satellite signals except PRN 10. (PRN10 is visible in the default configuration of Skydel and, as the last chip of the spreading code, it has the opposite sign of the first chip.)
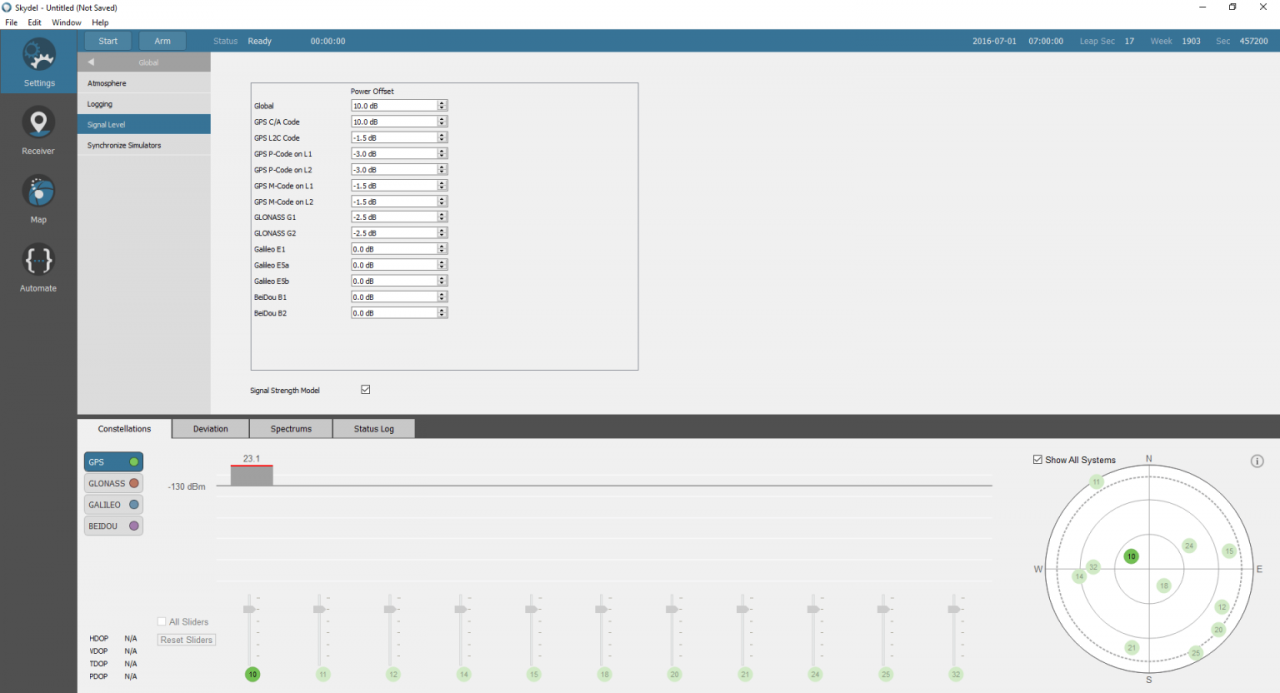
In GPS→ Signal level, set the global signal power and GPS C/A code to the maximum (10 dB each); this should ensure that the RF signal is displayed on the oscilloscope.
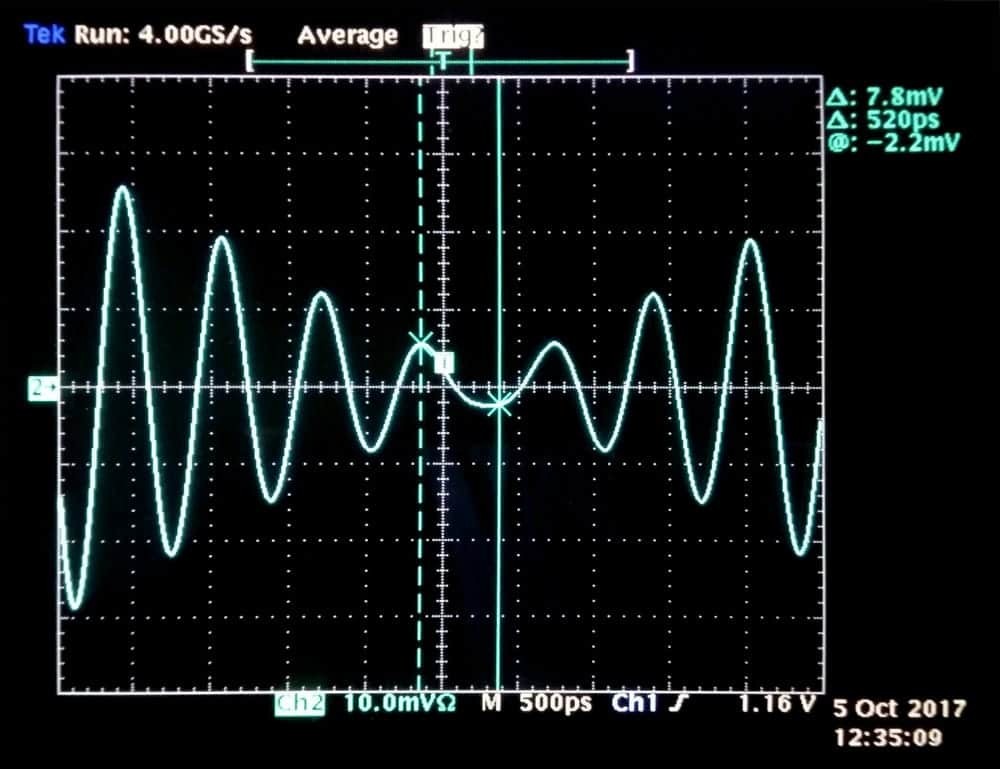
Run the simulation and adjust the oscilloscope to display both the 1 PPS signal and the RF signal. We can now accurately measure the delay between the rising edge of the 1 PPS and the phase inversion of the RF signal. This helps us determine the delay for which to compensate on all future measurements with the same laboratory setup.
Note: Due to a limitation with the oscilloscope used here, the 1 PPS signal is not drawn. However, the 50% rising edge is aligned with the vertical dashed line on the figure. The plain line is synchronized with the phase inversion of the RF signal. In this example, we measure a fixed offset of 520 +/- 100 ps between 1 PPS and RF signals.

Conclusion

While GNSS has shown itself to be an indispensable system for positioning and navigation, it is also critical for a number of timing applications such as banking or energy generation and transmission. For these types of applications, an accurate characterization of the timing receiver is essential; consequently, the use of a GNSS simulator is key to achieving such accuracy.

The power of Orolia’s Skydel GNSS simulator is its ability to synthesize all GNSS signals in baseband, which means that all satellites signals on the same frequency band are perfectly synchronized among themselves. As a result, the system timing calibration—a complicated and expensive operation on other systems—is highly simplified on the Skydel simulator.

Cybersecurity: Hardening security on your SecureSync

StableNet APM Pie Chart

Customers frequently seek information and recommendations from Orolia about hardening security, including general guidelines about available network security features, jamming and spoofing deterrence, bug fixes, and networking-related issues.

Sometimes they’re in search of specific practices for time servers and clients. Sometimes, because SecureSync® is part of critical infrastructure, they may not fully understand all the issues related to timing, such as GNSS jamming/spoofing, NTP vulnerability or the various types of network attacks.

Generally speaking, the correct answers are specific to each networking infrastructure and each customer’s policies. However, there are some general guidelines to follow to harden security on your SecureSync®, and this document should help. It covers the following areas and explains how to use each to prevent cyberattacks:

  • Authentication and authorization
  • HTTPS and SSL
  • SSH
  • SCP
  • SFTP with public/private support

This document also consolidates the recommendations from various product manuals into one handy location. They identify each security feature, shows default settings and offers recommendations about whether you should choose to enable it.

To make it easier, we’ve also provided links to the online manuals for each protocol — so configuration help is just a click away.

Don’t hesitate to call upon us for help with your timing applications, and be sure to ask us about other ways to harden your timing chain with Resilient PNT (positioning, navigation and timing) solutions that provide signal protection in the event of an outage, interference/detection/mitigation, and GNSS simulation to identify issues before they affect your critical infrastructure.

Resolving the Challenge of Duplicate Packets

Seamless monitoring of network traffic is critically important for enterprise network and security administrators: it lies at the very foundation of network threat detection and remediation. Regrettably, packet duplication has commonly been an undesirable side-effect of network traffic monitoring. Packet duplication produces redundant information in the monitoring traffic which can, besides overloading monitoring tools, result in packet drops, increased reporting of false positives, and seriously hamper the efficiency of SoC and NoC tools.

Packet recording has become a significant method to enable long-term traffic analysis and the stored information has been proven very valuable in case of security breach and calamity root cause analysis. Duplicate packets not only greatly increase the storage capacity, but the stored duplicate packets also often result in incorrect analysis results.

The common cause of duplicate packets in network monitoring traffic is through the use of the port mirroring feature of network switching devices, which is also known as a Switched Port Analyzer (SPAN). Using SPAN is a very common method of implementing network visibility. This feature, included in most enterprise-grade switches and routers, is a technique for copying packets traversing one or more switch ports sent to one or more network analysis tools.

The use of the SPAN port mirroring feature inevitably creates packet duplication. Specifically, port mirroring can be configured to only specify for packets into or out of a switch port. However, typically network administrators want a copy of both. The problem is when both the ingress and egress ports are mirrored; this results in duplicate packets being seen by network analysis tools. The timestamps may be different but the packet contents are the same. This challenge will be further compounded when SPAN is used for multiple connected devices.

In larger networks, tapping of traffic from multiple network segments, even the use of passive TAPs often results in packet duplication. Traffic traversing multiple network segments may be tapped by different TAPs and forwarded to the monitoring and inspection tools.

To avoid the adverse effects of packet duplication, the monitoring tools themselves may be forced to remove packet duplicates prior to implementing traffic analysis of the traffic. This scenario presents a number of challenges including bandwidth consumption on monitoring tools and consumption of precious processing resources on analysis tools impacting the CPU resources available for critical network analysis functions. The potential drop and processing resources available to the monitoring and analysis tool when it performs its own deduplication can be as high as 50%.

Packet Deduplication Solution

Packet deduplication refers to the capability for removing packet duplicates prior to network data being forwarded or transmitted to network analysis tools for the purpose of monitoring, analyzing, and recording. This typically causes a substantial reduction in the volume of traffic handled by such tools enabling an increase in their operational efficiency, a reduction in false-positive errors generated, and an elimination of security breaches that could exist in implementations without deduplication. Without duplicate packets being identified and removed first, analysis tools may generate erroneous alarms and/or produce compromised data and results.

In some cases, advanced network switches implement a basic level of software-based Layer 2 (L2) and Layer 3 (L3) deduplication as an optional feature on a per-port basis prior to forwarding traffic to an inline security tool.L2 deduplication removes identical Ethernet frames where the Ethernet header and the entire IP packet match, while L3 deduplication removes TCP or UDP packets where only the IP packet match. In such a case, the network switch checks for duplicates and removes only the immediately-previous packet if the duplicate arrives within a fixed type interval (typically in the order of a millisecond) of the original packet.

Deduplication and the Value of Network Packet Brokers

As enterprise network architectures continue to expand, network bandwidth levels continue to dramatically increase, newer tools for security, performance management, and monitoring keep getting deployed, a comprehensive network visibility layer is required.

That is exactly why in recent years Network Packet Brokers (NPBs) have come into play. Advanced network packet brokers allow a high level of deep packet inspection and processing including aggregation, filtering, and load balancing of traffic across the range of security and monitoring tools at data rates of up to 100 Gb/s.

With fine-grained, hardware-based deduplication typically built into advanced NPBs, the challenge of duplicate packets degrading the performance of security and monitoring tools is tackled in the best manner. With the advanced NPBs architecture, packets are sent to an internal packet processor for fine-grained, flexible flow-based deduplication and optimized for delivery to everything from IDS and IPS to forensics, network analyzers, data storage, and more.

Flow-based deduplication permits the elimination of duplicate packets using the range of attributes shared by IP packets in a flow including source IP, destination IP, protocol, and source and destination port. It may also enable the selection of inbound and outbound interfaces, CoS/QoS markings, TCP flags, and others.

Original article by Niagara Networks