Key Components to Monitor IP based Video

Over the last couple of years, the growth of IP-based video communtications and IP videoconferencing has explodied due to the the substantial increase of work from remote locations.

Video communications are expected to be smooth. Network teams need to be prepared, as video brings several unique challenges. This article will explore key video requirements and monitoring strategies to ensure the technology meets user expectations.

Managing in Real Time

The primary challenge differentiating management of videoconferencing performance from other applications is the real-time nature of the service. Even minimal quality issues can be incredibly disruptive. As a result, every effort must be made to ensure the network is “clean” and ready to support live IP-communications sessions. This requires a concerted effort by the network team to test/characterize and pre-qualify the network as videoconferencing ready. It also means finding ways to recognize problems as they happen. Efforts to identify and troubleshoot performance quality issues will also require the ability to reconstruct and study incidents in detail.

QoS: It’s Not an Option

Videoconferencing  services generate a significant amount of traffic  This means that network Quality of Service (QoS) class definitions and bandwidth allocations must be evaluated.  Allocating proper bandwidth to this application with increased presidence also raises the likelihood of contention among other applications for remaining network resources.

Configuring Monitoring Metrics

IT teams need to set Key Performance Indicators (KPIs) for videoconferencing quality. Typically latency, packet loss, and jitter are used as indicators of the network’s ability to support quality video. Specific to videoconferencing are metrics designed to reflect aggregate audio/video experiential quality, such as Video MOS (V-MOS). While not based on an industry standard (as is MOS, used with VoIP monitoring), it can be of great value if applied consistently to video traffic.

Keys to Monitoring Video Health

When monitoring videoconference performance, there are several options ranging from video-vendor provided tools to utilizing a comprehensive performance monitoring solutions.  The following are six key attributes you’ll want to consider to ensure your team is able to manage overall video health.

Monitoring Feature Benefit
Comprehensive expert video analytics Critical for immediate problem recognition and resolution. Provides fast and definitive views of VoIP and videoconferencing control protocols and session quality issues, plus IPTV analytics to quantify streaming video health.
Multi-vendor support While initial deployments are typically single vendor, long-term organizations tend to roll out a mix of vendor video solutions. Verify the monitoring system accommodates multiple manufacturers.
Video traffic in context Viewing video traffic alongside all other IP traffic is key to assessing the impact of other applications and ensuring quick and accurate problem resolution.
Long-term capture and storage Vital for reconstructing video sessions and reviewing problems in detail. Ensures that both communication control and content traffic can be inspected. Be sure the solution can capture up to 10 Gb network speeds, so you can count on having all the packets.
Integrated video infrastructure monitoring Collect and correlate underlying videoconferencing system components alongside system health metrics. Ensure support for popular vendors including Microsoft®, Cisco®, and Avaya®.
Aggregated and in-depth reporting Measure, track, and generate reports on VoIP and video MOS to validate session quality, as well as in-context views to reveal environmental factors and application contention that may be causing problems.

By preparing the network environment, evaluating QoS policies, and having comprehensive videoconferencing monitoring solutions in place, you can feel confident in your ability to meet user expectations with smooth video calls.

The Key Components of a Visibility Architecture

More mobile devices are now connecting to more data from more sources. IT challenges are complicated by increasingly high customer expectations for always-on access and immediate application response. This complexity creates network “blind spots” where latent errors germinate, and pre-attack activity lurks. Stressed-out monitoring systems make it hard, if not impossible, to keep up with traffic and filter data “noise” at a rate that they were not designed to handle. Network blind spots have become a costly and risk-filled challenge for network operators.

The answer to these challenges is a highly scalable visibility architecture that enables the elimination of your current blind spots, while providing resilience and control without added complexity.

Building blocks that make up an effective visibility Architecture.

  • Network Taps: These are the access devices that replicate network data and send it off to the monitoring infrastructure. While SPAN ports are often used for this as well, and are useful in many situations, here is a great article that walks through some differences between these access technologies.
  • Network Packet Brokers: Gathers the data from the network access points above and performs advanced filtering, deduplication, and aggregation of traffic to prep it for network tools
  • Network Monitoring Tools: Monitoring tools take the network traffic from the packet broker and provide analysis on network health, trends, and other types of insight to network operators.

These three components will remove blind spots and keep your applications running and your network secure.

How Common is GPS Jamming? (And How to Protect Yourself)

In 2013, the Federal Communications Commission fined a person almost $32k for using a device intended to evade the fleet management tracking system on his company vehicle. The device in question: a GPS jammer.

The incident occurred at the Newark Airport after FAA and NJ Port Authority officials struggled for over two years to determine why the new ground-based augmentation system (GBAS) – a system used primarily for augmenting aircraft take-off and landing systems – was experiencing intermittent failures. The cause of these failures seemed impossible to identify.

Eventually, with help from the FCC and with specialized equipment, they were finally able to identify the cause of these inexplicable problems: A contractor on site was using a GPS jammer that not only blocked his company vehicle’s fleet tracking system, it also took down the GBAS in the process.

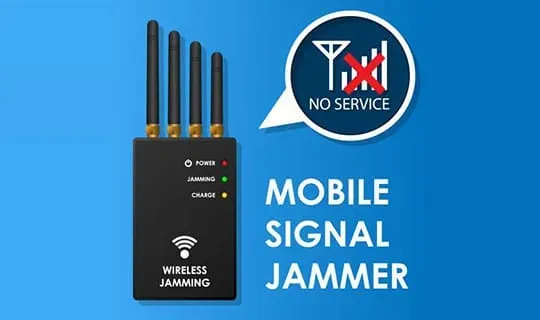
GPS jammers are usually small devices that plug into a vehicle’s lighter port and emit radio signals that overpower or drown out much weaker signals such as GPS or others. Although GPS jammers are illegal in the US, they are easily available online and are becoming more and more common as the use of fleet management tracking systems increases. These devices may seem relatively harmless at first glance, but their potential to cause harm is significant.

The case of the jammer at the Newark Airport is a perfect example. A simple $30 device was able to take down a state-of-the-art, highly sophisticated landing system at one of the busiest airports in the world. Worse, the device user wasn’t even trying to do so. Imagine what a person who DID intend to do harm could do?

Remember, GPS is used for much more than just navigation. It’s also the primary source of timing and synchronization in critical infrastructures such as financial, communications, industrial, the power grid, and more. In fact, these infrastructures are so critically reliant upon GPS for timing and synchronization that over the past several years, the Department of Homeland Security has begun an initiative to raise awareness of the threat and find solutions to safeguard these vital systems.

In timing applications, jammers can disrupt the GPS signal, causing the underlying systems to lose their ability to synchronize their internal clocks and, in turn, their ability to stay in sync with the rest of the network. Since many critical infrastructures sectors require synchronization across their network to be within millionths of a second, even short-term GPS outages can have a major impact. Worse, when an outage occurs, there’s typically nothing to indicate that it’s a result of jamming. The GPS signal simply is not received anymore.

To make matters even more dire, many of the datacenters that house the servers these networks run on are in warehousing districts (with trucks coming and going frequently) or near major highways. These are two of the most likely places to encounter GPS jammers. In fact, at Orolia they know from experience and real-life examples that it not only happens … it’s relatively common.

It was with these threats in mind that Orolia has developed solutions to protect its customers. Late last year, they announced the release of BroadShield, which uses sophisticated algorithms to interrogate the RF signal being consumed by GPS receivers to detect anomalies such jamming or spoofing. And recently, they released a new anti-jamming (AJ) antenna.

The new AJ antenna attenuates, or blocks, RF signals that come from near the horizon. True signals come from the satellites near the zenith. False interfering ones typically come from the horizon.

A good way to visualize how it works is to stand with your arms straight out to either side, parallel with the floor, and then raise them up to create a 30-degree angle from the floor. If you were a GPS antenna on the roof of a datacenter, any RF signal coming from below your arms would be blocked. Since the most common source of jamming comes from people trying to evade fleet management tracking systems – in cars or trucks, or on the ground – the AJ antenna is a very effective method of protecting critical networks.

The AJ antenna is also a drop-in replacement for traditional GPS antennas, making it easy to deploy. It requires no special power, mounting, or placement considerations beyond what a standard antenna needs. We’ve had a chance to test this with some customers who were experiencing GPS outages due to jamming and have recorded some remarkable results.

Tolly validates Cubro’s innovative Custos solution that cost effectively improves network performance, security posture, compliance and planning

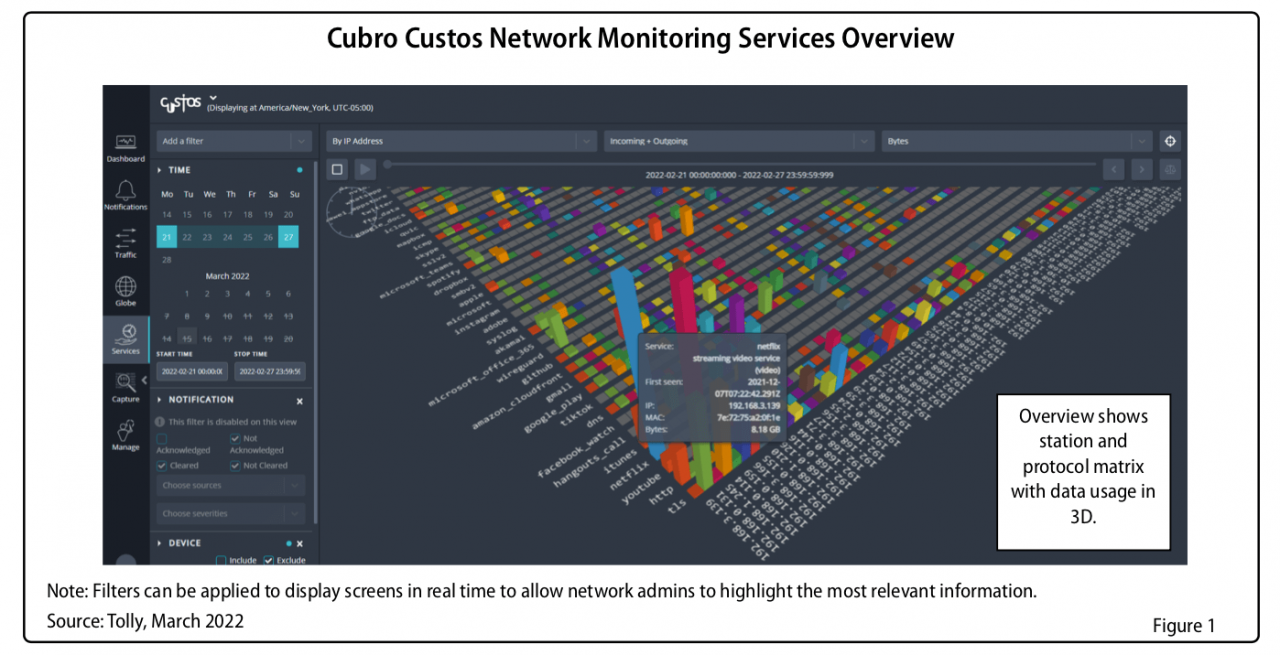
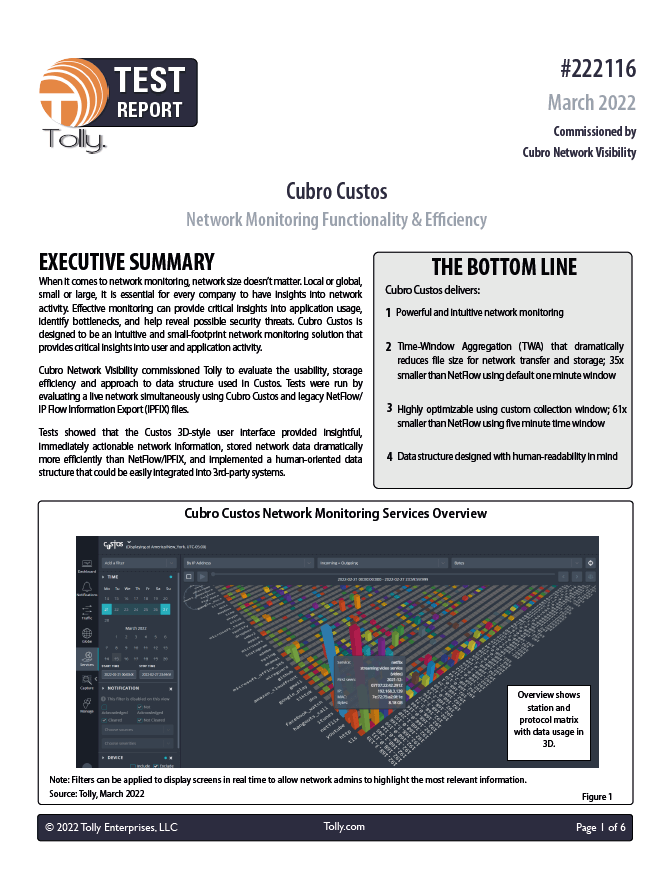
Cubro Network Visibility commissioned Tolly, a leading global provider of third-party validation services for vendors of IT products, components and services, to evaluate the usability, storage efficiency and approach to data structure used in Custos. Tests were run by evaluating a live network simultaneously using Cubro Custos and legacy NetFlow/ IP Flow Information Export (IPFIX) files.

Tests showed that the Custos 3D-style user interface provided insightful, immediately actionable network information, stored network data significantly more efficiently than NetFlow/IPFIX, and implemented a human-oriented data structure that could be easily integrated into 3rd-party systems.

Key takeaways of Tolly Report

  1. Powerful and intuitive network monitoring
  2. Time-Window Aggregation (TWA) that dramatically reduces file size for network transfer and storage
  3. Highly optimizable using custom collection window
  4. Data structure designed with human-readability in mind
  5. Discovery and visualisation of network devices, services & traffic

Time Window Based Monitoring Vs NetFlow (IPFIX)

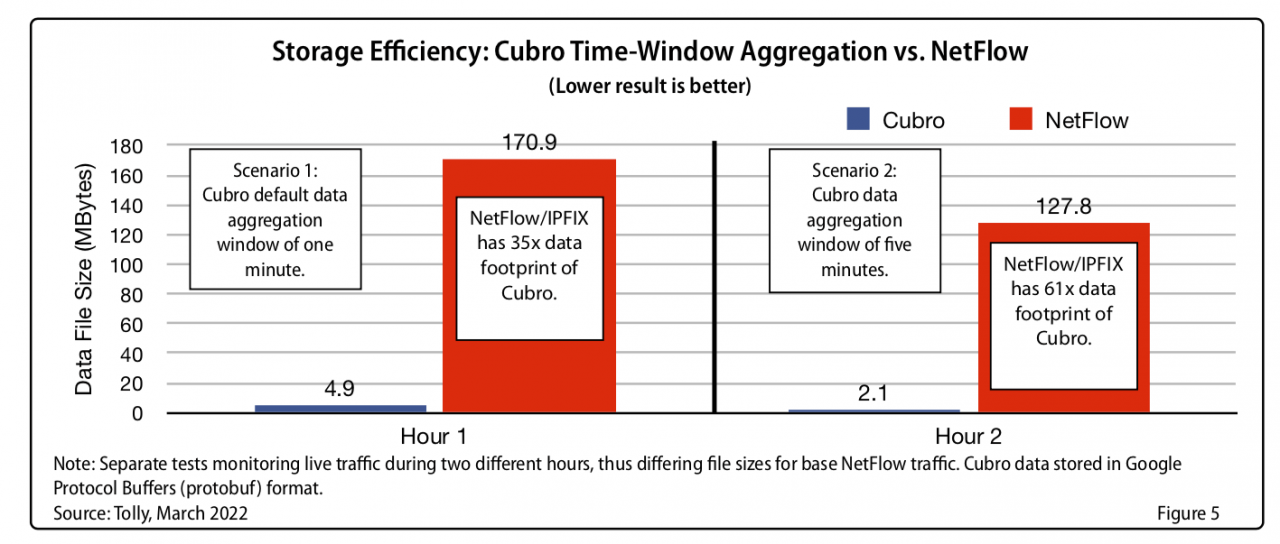
Time-series data is compiled from a collection of data points collected over a specified time interval; the time window. Cubro employs a customizable time-window, often 1 or 5 minutes. During the given time-window events are combined (time-window aggregation) creating a record that consists of a collection of packet, client, location and application information. The time window based processing has a compression ratio of 1:30 (1 minute) to 1:60 (5 minutes), and retains all important information while having the advantage of discarding redundant data.

The same data point may be collected numerous times over the time window interval, but will result in only a single entry into the aggregated record. To gain the same level of data resolution from NetFlow would require unsampled flow records. In this case one flow record is produced per packet analyzed. This produces a constant traffic stream to transport flow records to a collector where they are stored, processed, and analyzed.

The main issue is that these records contain a lot of redundant data that a time-window based method would have aggregated together at the onset. Ironically, flow data is often aggregated in some way during analysis to produce useful output but this is after transporting and storing larger data volume. Flow data can be sampled to reduce the overall output volume, however this comes at the cost of losing much of the resolution necessary for monitoring and security applications thus limiting its usefulness.

End-user Value of Custos Time Window Based Monitoring

  1. Reduces costs and increases the ROI of network tools
  2. Enhances the capabilities of network tools by enriching metadata
  3. Improves network performance by enhancing network monitoring
  4. Improve network security posture by enhancing network security monitoring
  5. Improves network planning and compliance by enhancing network analytics

Xplornet buys Manitoban internet business of Full Throttle Networks

Xplornet Communications, Canada’s largest rural-focused broadband provider, has completed the acquisition of the high speed internet business of Full Throttle Networks in Winnipeg, Manitoba. Full Throttle operates a fixed wireless network providing broadband access service to over 1,600 residential and commercial customers in Winnipeg and surrounding communities. The acquired customers are anticipated to benefit from Xplornet’s fibre-to-the-premises (FTTP) and 5G fixed wireless rollout plans in Manitoba, with the group currently expanding its fibre network across the province and upgrading towers with 5G equipment to deliver faster speeds to over 350 rural and 30 First Nation communities. Full Throttle customers located in the network upgrade areas will be able to take advantage of fixed wireless downlink/uplink speeds up to 100Mbps/10Mbps, as well as speeds of 1Gbps in fibre areas, once the project is complete.
Thanks to TeleGeography for this industry update.