Infosim® Global Webinar – Why is this App So Terribly Slow?

Infosim® Global Webinar Day
Why is this app so terribly slow?

How to achieve full
Application Monitoring with StableNet®

Infosim® Global Webinar Day September 24th, 2015 Why is this App So Terribly Slow?Join Matthias Schmid, Director of Project Management with Infosim® for a Webinar and Live Demo on “How to achieve full Application Monitoring with StableNet®”.

This Webinar will provide insight into:

  • Why you need holistic monitoring for all your company applications
  • How the technologies offered by StableNet® will help you master this challenge

Furthermore, we will provide you with an exclusive insight into how StableNet® was used to achieve full application monitoring for a global company.

Infosim® Global Webinar Day September 24th, 2015 Why is this App So Terribly Slow?b2ap3_thumbnail_Fotolia_33050826_XS_20150928-173035_1.jpg

A recording of this Webinar will be available to all who register!
(Take a look at our previous Webinars here.)

Thanks to Infosim for the article.

Is Network Function Virtualization (NFV) Ready to Deliver?

There is no doubt that virtualization is one of the hottest technology topics with communication service providers (CSPs) today. Nearly all the forecasts suggest that widespread NFV adoption will happen over the next few years, with CSPs benefitting from significantly reduced operational costs and much higher revenues resulting from increased service flexibility and velocity. So much for the hype – but where do NFV standards, guidelines and technology implementations stand today and when will the promised benefits be fully realized.

“Nearly all the forecasts suggest that widespread NFV adoption will happen over the next few years, with content service providers benefitting from significantly reduced operational costs and much higher revenues resulting from increased service flexibility and velocity.” – Ronnie Neil, JDSU

All analysts and CSPs agree that the introduction of virtualization will happen in phases. Exactly what the phases will be does vary from forecast to forecast, but a relatively common and simple model details the following three phases:

The financial benefits of virtualization will incrementally grow as each stage is reached with the full benefits not realized until stage 3 is reached. So where are we today in this NFV evolution?

  • Islands of specific network functions with no-to-little service chaining and manual configuration.
  • Either islands of specific network functions with dynamic self-configuration, or introduction of service chaining, but again employing manual configuration.
  • Finally, service chaining coupled with dynamic self-configuration functionality.

Phase 1 is already happening with some early commercial deployments of stand-alone virtualized network functions. hese deployments include virtualized functions of customer premise equipment (CPE), for example gateways and firewalls, and evolved packet core (EPC) components, such as HLRs and MMEs, these functions lending themselves to virtualization due to their software-only architectures. But generally speaking this is as far as commercial NFV deployments have reached in their evolution, with phases 2 and 3 still some way off. One of the main reasons for this is that these latter phases introduce major new requirements for the management tools associated with network virtualization.

And it is only recently that industry efforts to define standards, guidelines and best practices for the management and orchestration of NFV (or MANO as it is referred to) are starting. The emphasis up until now within research forums has been to focus on the basics of delivering the network function virtualization itself.

The TM Forum Zero-touch Operation, Orchestration, and Management (ZOOM) program is one of the foremost industry forums focused on the MANO aspects of virtualization. At this year’s TM Forum Live! event (Nice, France, June 1-4), the following two ZOOM-related catalyst projects will demonstrate aspects of MANO associated with NFV dynamic self-configuration.

  • Maximizing Profitability with Network Functions Virtualization
  • Operations Transformation and Simplifications Enabled by Virtual CPE

Thanks to Viavi Solutions for the article.

Why You Need NCCM As Part Of Your Network Management Platform

In the landscape of Enterprise Network Management most products (and IT Professionals) tend to focus on “traditional” IT monitoring. By that I mean the monitoring of devices, servers, and applications for performance issues and faults. That makes sense because most networks evolve in a similar fashion. They are first built out to accommodate the needs of the business. This primarily involves supporting access for people to applications they need to do their jobs. Once the initial buildout is done (or at least slows down) then next phase is typically implementing a monitoring solution to notify the service desk when there are problems. This pattern of growth, implementation, and monitoring continues essentially forever until the business itself changes through an acquisition or (unfortunately) a shutdown.

However, when a business reaches a certain size, there are a number of new considerations that come into play in order to effectively manage the network. The key word here is “manage” as opposed to “monitor”. These are different concepts, and the distinction is important. While monitoring is primarily concerned with the ongoing surveillance of the network for problems (think alarms that result in a service desk incident) – Network Management is processes, procedures, and policies that govern access to devices and change of the devices.

What is NCCM?

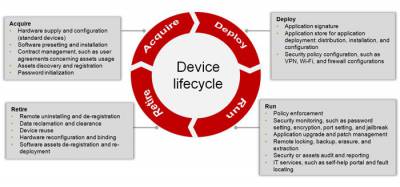
Commonly known by the acronym NCCM which stands for Network Configuration and Change Management – NCCM is the “third leg” of IT management with includes the traditional Performance and Fault Management (PM and FM). The focus of NCCM is to ensure that as network systems move through their common lifecycle (see figure 1 below) there are policies and procedures in place that ensure proper governance of what happens to them.

Figure 1. Network Device Lifecycle

Why You Need NCCM As Part Of Your Network Management Platform

Source: huawei.com

NCCM therefore is focused on the devices itself as an asset of the organization, and then how that asset is provisioned, deployed, configured, changed, upgraded, moved, and ultimately retired. Along each step of the way there should be controls put in place as to Who can access the device (including other devices), How they can access it, What they can do to it (with and without approval) and so on. All NCCM systems should also incorporate logging and auditing so that managers can review what happened in case of a problem later.

These controls are becoming more and more important in today’s modern networks. Depending on which research you read, between 60% and 90% of all unplanned network downtime can be attributed to a mistake made by an engineer when reconfiguring a device. Despite many organization having strict written policies about when a change can be made to a device, the fact remains that many network engineers can and will log into a production device during working hours and make on-the-fly changes. Of course, no engineer willfully brings down a core device. They believe the change they are making is both necessary and non-invasive. But as the saying goes “The road to (you know where) is paved with good intentions”.

A correctly implemented NCCM system can therefore mitigate the majority of these unintended problems. By strictly controlling access to devices and forcing all changes to devices to be both scheduled and approved, an NCCM platform can be a lifesaver. Additionally, most NCCM applications use some form of automation to accomplish repetitive tasks which are another common source of device misconfigurations. For example, instead of a human being making the same ACL change to 300 firewalls (and probably making at least 2-3 mistakes) the NCCM software can perform that task the same way, over and over, without error (and in much less time).

As NCCM is more of a general class of products and not an exact standard, there are many additional potential features and benefits of NCCM tools. Many of them can also perform the initial Discovery and Inventory of the network device estate. This provides a useful baseline of “what we have” which can be a critical component of both NCCM and Performance and Fault Management.

Most NCCM tools should also be able to perform a scheduled backup of device configurations. These backups are the foundation for many aspects of NCCM including historical change reporting, device recovery through rollback options, and policy checking against known good configurations or corporate security and access policies.

Lastly, understanding of the vendor lifecycle for your devices such as End-of-Life and End-of-Support is another critical component of advanced NCCM products. Future blog posts will explore each of these functions in more detail.

The benefits of leveraging configuration management solutions reach into every aspect of IT.

Configuration management solutions also enable organizations to:

  • Maximize the return on network investments by 20%
  • Reduce the Total Cost of Ownership by 25%
  • Reduce the Mean Time to Repair by 20%
  • Reduce Overexpansion of Bandwidth by 20%

Because of these operational benefits, NCCM systems have become a critical component of enterprise network management platforms.

Best Practices Guide - 20 Best Practices for NCCM

Thanks to NMSaaS for the article.

Cloud, Virtualization Solution – Example of Innovation

Our team is excited to represent Viavi Solutions during an industy (IT and cloud-focused) event, VMworld, in San Francisco at booth #2235. We’ll be showcasing our latest innovation – the GigaStor Software Edition designed for managing performance in virtual, cloud, and remote environments.

Here are some topline thoughts about why this product matters for our customers and core technologies trending today, what a great time it is for the industry and to be Viavi!

For starters, the solution is able to deliver quick and accurate troubleshooting and assurance in next generation network architecture. As networks become virtualized and automated through SDN initiatives, performance monitoring tools need to evolve or network teams risk losing complete visibility into user experience and missing performance problems. With GigaStor Software, engineers have real-time insight to assess user experience in these environments, and proactively identify application problems before they impact the user.

GigaStor Software Edition helps engineers troubleshoot with confidence in virtual and cloud environments by having all the traffic retained for resolving any challenge and expert analytics …leading to quick resolution.”

With the explosion of online applications and mobile devices, the role of cloud and virtualization will increase in importance, along with the need for enterprises and services providers need to guarantee around-the-clock availability or risk losing customers. With downtime costing companies $300K per hour or $5,600/minute, the solution that solves the problem the fastest will get the business. Walking the show floor at VMworld, IT engineers will be looking for solutions like GigaStor Software that help ensure quality network and services, as well as speed and accuracy when enabling advanced networks for their customers.

And, what a great time to be Viavi Solutions! Our focus on achieving visibility regardless of the environment and delivering real-time actionable insights in a cost-effective solution means our customers are going to be able to guarantee high levels of service and meet customer expectations without breaking the bank. GigaStor Software Edition helps engineers troubleshoot with confidence in virtual and cloud environments by having all the traffic retained for resolving any challenge and expert analytics that lead to quick resolution.

Thanks to Viavi Solutions for the article.

Do You Have a Network Operations Center Strategy?

The working definition of a Network Operations Center (NOC) varies with each customer we talk with; however, the one point which remains unified is that the NOC should be the main point of visibility for key functions that combine to provide business services.

The level at which a NOC ‘product’ is interactive depends on individual customer goals and requirements. Major equipment vendors trying to increase revenue are delving into management and visibility solutions with acquisitions and mergers, and while their products may provide many good features; those features are focused on their own product lines. In mixed vendor environments this becomes challenging and expensive, if you have to increase the number of visibility islands.

One trend we have seen emerging is the desire for consolidation and simplification within the Operations Centre. In many cases our customers may have the information required to understand the root cause but, getting to that information quickly is a major challenge across multiple standalone tools. Let’s face it, there will never be one single solution that will fulfill absolutely all monitoring and business requirements, and having specialized tools is likely necessary.

The balance lies in finding a powerful, yet flexible solution; one that not only offers a solid core functionality and feature set, but also encourages the orchestration of niche tools. A NOC tool should provide a common point of visibility if you want to quickly identify which business service is affected; easily determine the root cause of that problem, and take measures to correct the problem. Promoting integration with existing business systems, such as CMDB and Helpdesk, both northbound and southbound, will ultimately expand the breadth of what you can accomplish within your overall business delivery strategy. Automated intelligent problem resolution, equipment provisioning, and Change and Configuration Management at the NOC level should also be considered as part of this strategy.

Many proven efficiencies are exposed when you fully explore tool consolidation with a goal of eliminating overlapping technologies and process related bottlenecks, or duplication. While internal tool review often brings forth resistance, it is necessary, and the end result can be enlightening from both a financial and a process aspect. Significant cost savings are easily achieved with fewer maintenance contracts, but with automation a large percent of the non-value adding activities of network engineers can be automated within a product, freeing network engineers to work on proactive new innovations and concepts.

Do You Have a  Network Operations Center Strategy?The ‘Dark Side’

Forward thinking companies are deploying innovative products which allow them to move towards unmanned Network Operations Center, or ‘Dark NOC’. Factors such as energy consumption, bricks and mortar costs, and other increasing operational expenditures strengthen the fact that their NOC may be located anywhere with a network connection and still provide full monitoring and visibility. Next generation tools are no longer a nice to have, but a reality in today’s dynamic environment! What is your strategy?

The Case for an All-In-One Network Monitoring Platform

There are many famous debates in history: dogs vs cats, vanilla vs chocolate & Coke vs Pepsi just to name a few. In the IT world, one of the more common debates is “single platform vs point solution”. That is, when it comes to the best way to monitor and manage a network, is it better to have a single management platform that can do multiple things, or would it be better to have an array of tools that are each specialized for a job?

The choice can be thought of as being between Multitaskers & Unitaskers. Swiss Army knives, vs dedicated instruments. As for most things in life, the answer can be complex, and probably will never be agreed upon by everyone – but that doesn’t mean we can’t explore the subject and form some opinions of our own.

For this debate, we need to look the major considerations which go into this choice. That is, what key areas need to be addressed by any type of network monitoring and management solution and then how do our two options fair in those spaces? For this post, I will focus on 3 main areas to try to draw some conclusions:

  • Initial Cost
  • Operations
  • Maintenance

1) Initial Cost

This may be one of the more difficult areas to really get a handle on, as costs can vary wildly from one vender to another. Many of the “All-In-One” tools come with a steep entry price, but then do not grow significantly after that. Other AIO tools offer flexible licensing options which allow you to only purchase the particular modules or features that you need, and then easily add-on other features when you want them.

In contrast, the “Point-Solutions” may not come with a large price tag, but you need to purchase multiple tools in order to cover your needs. You can therefore take a piecemeal approach to purchasing which can certainly spread your costs out as long as you don’t leave critical gaps in your monitoring in the meantime. And, over time, the combined costs for many tools can become larger than a single system.

Newer options like pay-as-you-go SaaS models can greatly reduce or even eliminate the upfront costs for both AOI and Point Solutions. It is important to investigate if the vendors you are looking at offer that type of service.

Bottom Line:

Budgets always matter. If your organization is large enough to absorb the initial cost of a larger umbrella NMS, then this typically leads to a lower total cost in the long run, as long as you don’t also need to supplement the AIO solution with too many secondary solutions. SaaS models can be a great way to get going with either option as they reduce the initial Cap-Ex spend necessary.

2) Operations

In some ways, the real heart of the question AIO vs PS comes should come down to this – “which choice will help me solve issues more quickly”? Most monitoring solutions are used to respond when there is an issue with service delivery, and so the first goal of any NMS should be to help the IT team rapidly diagnose and repair problems.

When thought of in the context of the AIO vs PS debate, then you need to think about the workflow involved when an alarm or ticket is raised. With an AIO solution, an IT pro would immediately use that system to try both see the alarm and then to dive into the affected systems or devices to try and understand the root cause of the problem.

If the issue is systemic (meaning that multiple locations/users/services are affected) then an AIO solution has the clear advantage of being able to see a more holistic view of the network as a whole instead of just a small portion as would be the case for many Point Solutions. If the AIO application contains a root cause engine then this can be a huge time saver as it may be able to immediately point the staff in the right direction.

On the other hand, if that AIO solution cannot see deeply enough into the individual systems to pinpoint the issues, then a point solution has an advantage due to its (typically) deeper understanding of the systems it monitors. It may be that only a solution provided directly by the systems manufacturer would have insight into the cause of the problem.

Bottom line

All In One solutions typically work best when problems occur which affect more than one area of the network. Whereas Point Solutions may be required if there are proprietary components that don’t have good support for standards based monitoring like SNMP.

3) Maintenance

The last major consideration is one that I don’t think gets enough attention in this debate- the ongoing maintenance of the solutions themselves i.e. “managing the management solutions”. All solutions require “maintenance” to keep them working optimally. There are upgrades, patches, server moves etc. There are also the training requirements of any staff that need to use these systems. This can add up to significant time and energy “costs”.

This is where AIO solutions can really shine. Instead of having to maintain and upgrade many solutions, your staff can focus on maintaining a single system. The same thing goes for training – think about how hard it can be to really become an expert in anything, then multiply that by the training required to become proficient at X number of tools that your organization has purchased.

I have seen many places where the expertise in certain tools becomes specialized – and therefore becomes a single point of failure for the organization. If only “Bob” knows how to use that tool, then what happens when there is a problem and “Bob” in on vacation, or leaves the group?

Bottom Line:

Unless your organization can spend the time and money necessary to keep the entire staff fully trained on all of the critical network tools, then AIO solutions offer a real advantage over point solutions when it comes to maintainability of your IT management systems.

In the end, I suspect that this debate will never completely be decided. There are many valid reasons for organizations to choose one path over another when it comes how to organize their IT monitoring platforms.

In our view, we see some real advantages to the All-In-One solution approach, as long as the platform of choice does not have too many gaps in it which then need to be filled with additional point solutions.

Thanks to NMSaaS for the article.

Viavi Solutions Launches GigaStor Software Edition for Virtual and Cloud Environments

Viavi Solutions Launches GigaStor Software Edition for Virtual and Cloud Environments

Solution Delivers Fast and Accurate Troubleshooting and Assurance in Next Generation Network Architecture

(NASDAQ: VIAV) Viavi Solutions Inc. (“Viavi”) today announced it is expanding its portfolio of software-defined network test and monitoring solutions with the new GigaStor Software Edition to manage performance and user experience in virtual and cloud environments. The new software configurations, which Viavi is demonstrating at VMworld, allow network and server teams to capture and save 250 GB or 1 TB of continuous traffic to disk for in-depth performance and forensic analysis.

“IT teams are wasting a lot of time by only tracking virtual server and resource health,” said Charles Thompson, senior director of product management, Viavi Solutions. “These teams can often miss problems associated with applications within the hypervisor with such narrow vision. With GigaStor Software engineers now have the ability to see in real time and historically how users are experiencing applications and services within the virtual environment, saving time and end-user heartache.”

Without GigaStor’s insight, engineers could spend hours replicating a network error before they can diagnose its cause. GigaStor Software captures packet-data from within the virtual switching infrastructure without needing to push data into the physical environment. It can be deployed in any virtual host for the long-term collection and saving of packet-level data, which it can decode, analyze, and display. Additionally, it provides IT teams with greater accuracy and speed in troubleshooting by having all packets available for immediate analysis.

Utilizing the GigaStor Software and appliances, network teams can monitor and analyze all virtual datacenter traffic whether within a VMware ESX host or on 10 and 40 Gigabit Ethernet links. GigaStor Software is available today for purchase, and is being demonstrated during VMworld in San Francisco at Viavi Solutions booth #2235.

Thanks to Viavi for the article. 

External Availability Monitoring – Why it Matters

Remember the “good old days” when everyone that worked got in their car and drove to a big office building every day? And any application that a user needed was housed completely within the walls of the corporate datacenter? And partners / customers had to dial a phone to get a price or place an order? Well, if you are as old as I am, you may remember those days – but for the vast majority you reading this, you may think of what I just described as being about as common as a black and white TV.

The simple fact is that as the availability and ubiquity of the Internet has transformed the lives of people, it has equally (if not more dramatically) transformed IT departments.In some way this has been an incredible boon, for example, I can now download and install new software in a fraction of the time it used to take to purchase and receive that same software on CD’s (look it up kids).

Users can now login to almost any critical business application from anywhere there is a Wi-Fi connection. They can probably perform their job function to nearly 100% from their phone….in a Starbucks…. or on an airplane…..But of course, with all of the good, comes (some) of the bad – or at least difficult challenges for the IT staff whose job it is to keep all of those applications available to everyone , everywhere, all of the time. The (relatively) simple “rules” for IT monitoring need to be re-thought and extended for the modern work place. This is where External Availability Monitoring comes in.

We define External Availability Monitoring (EAM) as the process through which your critical network services and the applications that run over them are continuously tested from multiple test points which simulate real world geo-diversity and connectivity options. Simply put, you need to constantly monitor the availability and performance of any public facing services. This could be your corporate website, VPN termination servers, public cloud based applications and more.

This type of testing matters, because the most likely cause of service issues today is not call from Bob on the 3rd floor, but rather Jane who is currently in a hotel in South America and is having trouble downloading the latest presentation from the corporate intranet which she needs to deliver tomorrow morning.

Without a proactive approach to continuous service monitoring, you are flying blind as to issues that impact the global availability – and therefore operations- of your business.

So, how is this type of monitoring delivered? We think the best approach is to setup multiple types of tests such as:

  • ICMP Availability
  • TCP Connects
  • DNS Tests
  • URL Downloads
  • Multimedia (VoIP and Video) tests (from external agent to internal agent)
  • Customized application tests

These tests should be performed from multiple global locations (especially from anywhere your users commonly travel). This could even include work from home locations. At a base level, even a few test points can alert you quickly to availability issues.

More test points can increase the accuracy with which you can pinpoint some problems. It may be that the incident seems to be isolated to users in the Midwest or is only being seen on apps that reside on a particular cloud provider. The more diverse data you collect, the swifter and more intelligent your response can be.

Alerts should be enabled so that you can be notified immediately if there is an issue with application degradation, or “service down” situation. The last piece to the puzzle is to quickly be able to correlate these issues with underlying internal network or external service provider problems.

We see this trend of an “any application, anywhere, anytime” service model becoming the standard for IT departments large and small. With this shift comes an even greater need for continuous & proactive External Availability Monitoring.

External Availability Monitoring - Why it Matters

Thanks to NMSaaS for the article.

Infosim® Global Webinar Day – How to prevent – Or Recover From – a Network Disaster

Oh. My. God. This time it IS the network!

How to prevent – or recover from – a network disaster

Jason Farrer Join Jason Farrer, Sales Engineer with Infosim® Inc. for a Webinar and Live Demo on “How to prevent – or recover from – a network disaster”.Join Jason Farrer, Sales Engineer with Infosim® Inc. for a Webinar and Live Demo on “How to prevent – or recover from – a network disaster”.


This Webinar will provide insight into:

  • Why is it important to provide for a network disaster?
  • How to deal with network disaster scenarios [Live Demo]
  • How to prevent network corruption & enhance network security

Watch Now!

Infosim® Global Webinar Day August 27th, 2015

A recording of this Webinar will be available to all who register!
(Take a look at our previous Webinars here.)

Thanks to Infosim for the article.

The 3 Most Important KPI’s to Monitor On Your Windows Servers

Much like monitoring the heath of your body, monitoring the health of your IT systems can get complicated. There are potentially hundreds of data points that you could monitor, but I am often asked by customers to help them decide what they should monitor. This is mostly due to there being so many available KPI options that can be implemented.

However, once you begin to monitor a particular KPI, then to some degree you are implicitly stating that this KPI must be important (since I am monitoring it) and therefore I must also respond when the KPI creates an alarm. This can easily (and quickly) lead to “monitor sprawl” where you end up monitoring so many data point and generating so many alerts that you can’t really understand what is happening – or worse yet – you begin to ignore some alarms because you have too many to look at.

In the end, one of the most important aspects of designing a sustainable IT monitoring system is to really determine what the critical performance indicators are, and then focus on those. In this blog post, I will highlight the 3 most important KPI’s to monitor on your windows servers. Although, as you will see, these same KPI’s would be suited for any server platform.

1. Processor Utilization

Most monitoring systems have a statically defined threshold for processor utilization somewhere between 75% and 85%. In general, I agree that 80% should be the “simple” baseline threshold for core utilization.

However, there is more than meets the eye to this KPI. It is very common for a CPU to exceed this threshold for a short period of time. Without some consideration for the length of time that this mark is broken, a system could easily generate a large number of alerts that are not actionable by the response team.

I usually recommend a “grace period” of about 5 minutes before an alarm should be created. This provides enough time for a common CPU spike to return to an OK state, but is also short enough that when a real bottleneck occurs due to CPU utilization, the monitoring team is alerted promptly.

It is also important to take into consideration the type of server that you are monitoring. A well scoped out VM should in fact see high average utilization. In that case, it may be useful to also monitor a value like the total percentage interrupt time. You may want to alarm when total percentage interrupt time is greater than 10% for 10 minutes. This value, combined with the standard CPU utilization mentioned above can provide a simple but effective KPI for CPU health.

2- Memory Utilization

Similar to CPU, memory bottlenecks are usually considered to take place at around 80% memory utilization. Again, memory utilization spikes are common enough (especially in VM’s) that we want to allow for some time before we raise an alarm. Typically, memory utilization over 80-85% for 5 minutes is a good criteria to start with.

This can be adjusted over time as you get to understand the performance of particular servers or groups of servers. For example, Exchange servers typically have a different memory usage pattern compared to Web servers or traditional file servers. It is important to baseline these various systems and make appropriate deviations in the alert criteria for each.

The amount of paging on a server is also a memory related KPI which is important to track. If your monitoring system is able to track memory pages per second, then I recommend also including this KPI in your monitoring views. Together with standard committed memory utilization these KPI’s provide a solid picture of memory health on a server.

3- Disk Utilization

Disk Drive monitoring encompasses a few different aspects of the drives. The most basic of course is drive utilization. This is commonly measured as an amount of free disk space (and not as an amount of used disk space).

This KPI can should be measured both as a percentage of free space – 10% is the most common threshold I see – as well as an absolute value, for example 200MB free. Both of these metrics are important to watch and should have individual alerts associated with their capacity KPI. It is also key to understand that a system drive might need a different threshold as compared to nonsystem drives.

A second aspect of HDD performance is the KPI’s associated with the time it takes for disk reads and writes. This is commonly described as “average disk seconds per transfer” although you may see this described in other terms. In this case the hardware that is used greatly influences the correct thresholds for such a KPI, so I cannot make a recommendation here. However, most HDD manufacturers will provide a KPI for their drives that is appropriate. You can usually find information on the vendors website for your specific drives.

The last component of drive monitoring seems obvious, but I have seen many monitoring systems that unfortunately ignore it (usually because it is not enabled by default and nobody ever thinks to check) and that is pure logical drive availability. For example checking the availability on a server of the C:\ , D:\ and E:\ Drives (or whatever should exist). This is simple, but can be a lifesaver when a drive is lost for some reason and you want to be alerted quickly.

Summary:

In order to make sure that your Windows servers are fully operational, there are few really critical KPIs that I think you should focus on. By eliminating some of the “alert noise” you can make sure that important alerts are not lost.

Of course each server has some application / service functions that also need to be monitored. We will explore the best practices for server application monitoring in a further blog post.

http://www.telnetnetworks.ca/en/contact-us.html

Thanks to NMSaaS for the article.