Your GPUs Are Idle. It’s Probably Not the GPUs’ Fault.

Telnet Networks blog header — Your GPUs Are Idle: validating AI data center performance with Keysight KAI solutions

Canada is building AI data centres at unprecedented scale. Here’s how to make sure the fabric underneath them actually performs — before the capital is committed.

In May 2026, the Government of Canada and TELUS announced work to advance a sovereign AI factory cluster in British Columbia. This build is designed to scale beyond 60,000 GPUs and 150 megawatts by 2032, drawing on an initial 85 MW of clean power from BC Hydro. Two months earlier, Bell committed $1.7 billion over two years to a 300 MW facility outside Regina, leasing capacity to Cerebras and CoreWeave.

Behind those projects sits the Canadian Sovereign AI Compute Strategy, a $2 billion federal commitment, and the AI Sovereign Compute Infrastructure Program, which allocates roughly $890 million over seven fiscal years beginning in 2026–27.

This is the largest concentrated infrastructure build Canadian networking teams have seen in a generation. And it is happening on a compressed schedule, with hardware that behaves nothing like the enterprise networks most of us have spent our careers operating.

If you are standing up GPU capacity, whether at a service provider, a bank, a research institution, or an enterprise bringing models in-house, this post is about the failure mode that quietly erodes the return on all of it, and the practical sequence for catching it before you have poured concrete.

The gap between what you bought and what you get

Start with a number that should be uncomfortable for anyone who has signed a GPU purchase order.

Model FLOPs Utilization (MFU) measures how much of a cluster’s theoretical peak compute a training run actually converts into useful work. It is the honest measure of whether you are getting what you paid for. The published figures from teams with world-class infrastructure engineering are humbling:

Training runReported MFU
GPT-321.3%
Megatron-Turing NLG 530B30.2%
Gopher32.5%
PaLM 540B46.2% (57.8% including rematerialization)
Megatron-LM on H100 clustersup to ~47%

These are among the most carefully optimized training runs ever executed. They still leave half or more of the theoretical compute on the table.

An important caveat, because it matters for diagnosis: the MFU gap is not all network. Memory-bound operations, pipeline bubbles, kernel inefficiency, and suboptimal parallelism strategy all contribute. Anyone telling you the fabric explains the entire gap is selling something.

But here is what separates the network portion from the rest: it gets worse as you scale, and it is the part you commit to irreversibly when you buy hardware. You can refactor a kernel next quarter. You cannot re-cable a spine layer that was undersized for the traffic pattern you actually run.

Why AI fabrics fail differently

Traditional enterprise networks optimize for north-south traffic and client-server patterns. Loss is tolerable, retransmission is routine, and a few milliseconds of jitter is invisible to the user.

AI training fabrics operate under different physics. Three properties drive almost every problem worth knowing about.

Collective operations create hard synchronization dependencies. When a distributed training job runs an AllReduce, every participating GPU must complete its exchange before the job advances. The job proceeds at the pace of the slowest worker. One congested rack does not slow that rack by 10% — it stalls the entire cluster. Localized congestion produces cluster-wide idle time, which is why the symptom you see (idle accelerators) is so far removed from the cause.

Elephant flows collide at predictable choke points. AI training generates a small number of very large, long-lived flows rather than many small ones. When these converge on the same uplink, you get buffer exhaustion and drops. Meta’s engineering team documented this directly in their production RoCE deployment: fragmented job placement causing congestion on particular switch uplinks degraded training performance by more than 30%. That is a real production number from a team with world-class network engineering, not a vendor projection.

Loss recovery in RDMA is brutally inefficient. When a packet drops in an RDMA transfer, the protocol generally cannot recover it selectively. It waits for a timeout and retransmits the entire operation, or every packet following the loss. A single dropped packet can force retransmission of a very large transfer. Researchers have injected controlled loss rates as low as 0.1% into GPU training setups precisely because the effects compound so sharply at scale.

In an AI fabric, congestion is not a bandwidth problem. It is a synchronization problem.

None of these behaviours appear in a link-level throughput test. They emerge from the interaction of topology, congestion-control tuning, buffer strategy, and the specific communication pattern of your workload: at scale, under load, and over hours.

Which is why most teams discover them after the hardware is racked.

The validation gap

Here is the position most infrastructure teams find themselves in.

You can validate components. You can confirm a switch forwards at line rate, an optical transceiver meets spec, or a NIC negotiates correctly. All necessary, but none of it tells you whether a 256-node training job will hit congestion collapse at the spine under a real AllReduce pattern.

The conventional options are all unsatisfying:

  • Test with synthetic traffic. Generic load generators produce traffic that does not resemble collective communication. You validate the fabric against a workload you will never run.
  • Test with the real cluster. This requires owning the GPUs first, meaning the capital is committed and the topology decisions are locked.
  • Find out in production. The most common approach, and by a wide margin the most expensive.

What is missing is a way to observe system-level behaviour before the system physically exists.

A practical validation roadmap

The gap between “we know AI fabrics are different” and “we have proven ours works” is where most programs stall. Here is the sequence we recommend, and where each step fits in an existing network performance testing practice.

Step 1: Emulate the workload, not just the traffic. This is the foundational step, and the one most teams skip. Keysight, whose network test lineage runs back through Ixia, has extended that portfolio into AI infrastructure with KAI Data Center Builder. Rather than generating synthetic load, it emulates the actual collective operations training jobs run: AllReduce, AllGather, ReduceScatter, AlltoAll, Broadcast and Gather, across ring, tree, halving-doubling and PXN algorithms. Critically, it works with the collective communication libraries teams actually deploy, such as NCCL on NVIDIA, RCCL on AMD, or MSCCL on Microsoft, driving RDMA and RoCEv2 traffic across 400G, 800G and 1.6T fabrics.

The practical consequence is that you can model a topology before purchasing it: compare spine-leaf variations, oversubscription ratios, and switch vendors against the same repeatable workload, and see how job completion time responds.

Step 2: Look at the mechanisms, not just the throughput number. An aggregate bandwidth figure will not tell you why a job stalled. What you need is visibility into PFC pause behaviour, ECN and DCQCN response, retransmission counts, and ECMP hashing efficiency: the specific mechanisms that turn a healthy fabric into an idle cluster. Emulation platforms expose these directly, with hardware-based congestion notification and per-queue-pair rate control, so a congestion event becomes reproducible rather than anecdotal.

Step 3: Test without tying up accelerators. This is usually the strongest part of the business case. Software-based agents run directly on standard servers and scale horizontally, which means validating your fabric does not require a lab full of scarce, expensive GPUs. For an organization competing for accelerator supply, freeing that hardware for actual training work is not a minor consideration.

Step 3: Test without tying up accelerators. This is usually the strongest part of the business case. Software-based agents run directly on standard servers and scale horizontally, which means validating your fabric does not require a lab full of scarce, expensive GPUs. For an organization competing for accelerator supply, freeing that hardware for actual training work is a major consideration.

Step 4: Make your telemetry trustworthy with precision time. This one is easy to overlook and painful to retrofit. Diagnosing a distributed training stall means correlating events across hundreds of nodes, switch counters, and GPU telemetry streams. If those sources disagree about what time it is, reconstructing the sequence becomes guesswork. At the microsecond scale where congestion events unfold, ordinary NTP drift is enough to make a timeline meaningless. Resilient, GNSS-backed network time from partners like Safran ensures every log, capture, and counter shares one accurate, traceable clock. It is the same foundational control we have written about in the context of Zero Trust architecture, and it matters here for exactly the same reason.

Step 5: Carry the visibility into production. Pre-deployment validation tells you the design is sound. It does not tell you what changed last Tuesday. Network TAPs and packet brokers give your monitoring stack a complete, reliable copy of what is actually traversing the fabric, and platforms like StableNet maintain the live inventory and configuration baseline you will need when someone asks why throughput dropped 12% after a firmware update. Validation is not a gate you pass once: every speed upgrade, node expansion, and serving-stack change shifts the performance profile.

The other half of the bill: inference

Training gets the attention. Inference gets the recurring invoice.

For organizations running models in production, cumulative inference spend eventually exceeds the one-time training investment. Industry estimates commonly place inference at the large majority of lifetime compute cost, and the mechanism is straightforward: per-token costs keep falling, but token volume grows far faster, so the total bill climbs even as unit economics improve.

Inference also fails in ways users feel immediately. Time to first token determines whether an assistant feels responsive or broken. Concurrency limits determine whether the system holds up at 9am Monday. And the bottleneck could be almost anywhere — GPU compute, HBM bandwidth, KV-cache capacity, the PCIe or RDMA interconnect, the model engine, the orchestrator, the load balancer, or the security gateway sitting in front of all of it.

Open-source benchmarks will not find it. They run idealized, uniform workloads. Real users send prompts of wildly varying shape, in bursts, with patterns specific to the industry and application — which is why a model serving legal research behaves nothing like one serving customer support.

Keysight’s KAI Inference Builder addresses this by emulating realistic inference clients at production scale, using prompt libraries modelled on actual user behaviour across verticals including finance, legal, healthcare and academia. It validates the full path through firewalls, load balancers, and smart NICs, across both east-west and north-south traffic. It also correlates client-side metrics with inference engine telemetry such as vLLM statistics and GPU telemetry such as DCGM data in a single time-synchronized view.

That correlation is the point. It turns “inference feels slow” into a specific, actionable finding: the exact concurrency level where KV-cache saturates and time-to-first-token begins degrading past your target. One of those statements you can engineer against.

Getting the foundation right

Canada is committing billions of dollars and years of construction to AI infrastructure. The organizations building it are working to schedules set by funding cycles and power availability, not by how long careful validation takes.

That pressure is precisely why the validation step gets compressed — and precisely why it should not be. Every published MFU figure tells the same story: the gap between theoretical and realized performance is large even for the best-resourced teams in the world. Some of that gap is unavoidable. The portion attributable to fabric design is not, but it is only addressable while the design is still on paper.

Emulation is how you check the assumptions before the capital is committed, and how you keep checking as you scale. Not because testing is inherently virtuous, but because the alternative is discovering your model was wrong after it has been converted into steel, concrete, and fibre.

A few questions worth putting to your team this quarter:

  1. What MFU are we actually achieving during training runs, and have we decomposed the gap between network, memory, and kernel efficiency?
  2. When we deploy new switches, NICs, or nodes, how do we validate performance before production?
  3. If a training job slowed 30% tomorrow, how long would it take us to identify the root cause?
  4. Do we know our inference concurrency ceiling: the measured number, not an estimate?
  5. Are our logs and telemetry synchronized closely enough to reconstruct a congestion event after the fact?

If any of those produce an uncomfortable pause, that is the conversation worth having.

That’s where we can help. Telnet Networks has spent more than 25 years helping Canadian service providers, financial institutions, government agencies, and enterprises build networks that perform under pressure — and our partnership with Keysight extends that work into AI infrastructure validation. Our engineering team can walk through your environment, map where your current testing practice stops short of AI workload behaviour, and arrange a technical session with Keysight’s AI specialists.e stops short of AI workload behaviour, and arrange a technical session with Keysight’s AI specialists.

Planning a GPU cluster deployment or expansion? Contact the Telnet Networks team for a no-obligation consultation.


Further reading: the Canadian Sovereign AI Compute Strategy and the Government of Canada–TELUS sovereign AI announcement; Meta’s engineering write-up on RoCE networks for distributed AI training at scale; the PaLM paper for MFU methodology and comparative figures; Juniper’s Networking the AI Data Center white paper; and Keysight’s white papers on Benchmarking Collective Operations and Improving Scalability in AI Data Center Clusters.

Candela Technologies – Evolving with Changing Technology

Candela Technologies Logo

Modern ISPs and large enterprises are building networks that are more complex than ever before. With the rapid expansion of Wi-Fi 7, diverse IoT ecosystems, and increasingly deployment requirements, network engineering teams need testing environments that reflect real-world chaos. Over the past six months, Candela Technologies has rolled out significant updates to its LANforge network testing suite, ensuring organizations can validate next-generation networks before they hit production.

Here is a roundup of the latest developments and what they mean for Service Provider test labs.

Expanding TR-398 and Wi-Fi 7 Capabilities

For ISPs, ensuring Wi-Fi performance meets Broadband Forum standards is no longer optional. Candela has significantly matured its support for Wi-Fi 7 (802.11be) and aligned its automated testing scripts with the latest TR-398 Issue 4 specifications.

A major focus of this update is standardizing how high-bandwidth testing is handled. LANforge now defaults to a 160MHz bandwidth for Wi-Fi 7 testing on the 6GHz band, while still allowing 320MHz options for custom performance benchmarking. More importantly, the system brings critical stability and reporting fixes for Multi-Link Operation (MLO). Candela has introduced intelligent overrides for MLO testing—specifically mapping eMLSR (enhanced Multi-Link Single Radio) test scenarios to Intel be200 radios, and MLO-STR (Simultaneous Transmit and Receive) to MediaTek MTK7996 chipsets. For service providers, this means highly accurate, vendor-specific validation of advanced Wi-Fi 7 routing without the headache of manual configuration conflicts.

Streamlined Enterprise Deployment with Domain Controllers

Managing standalone test equipment in a heavily secured corporate environment can be an administrative bottleneck. Recognizing the operational needs of large enterprises, Candela has introduced initial support for deploying LANforge systems using Windows Domain Controllers.

Instead of managing isolated local credentials for every piece of test hardware in the lab, network administrators can now integrate LANforge directly into their existing Windows Domain infrastructure. This streamlines user access, easily enforces corporate security policies across the test lab, and dramatically reduces the friction of deploying scalable, software-defined testing within highly regulated enterprise environments.

Enhanced Interoperability and IoT Automation

Validating Access Points requires testing against the devices users actually bring to the network. Candela has dramatically expanded its mobile and IoT automation capabilities:

  • Advanced Apple Ecosystem Support: LANforge now supports interoperability testing for iOS version 26, alongside improved auto-discovery logic. A new feature allows automated “typing” through Bluetooth connectivity, simplifying interaction with headless or restricted iOS devices.
  • Android and Wearables: The platform introduces robust Extensible Authentication Protocol (EAP) connectivity automation for modern Android handsets. Furthermore, Candela has improved automated testing for Android-based IoT devices, including smart glasses and smartwatches, ensuring robust connectivity across the growing wearable market.

Protocol and Performance Upgrades

At the protocol level, LANforge now supports HTTP3 (QUIC) using layer-4 endpoints, allowing engineers to benchmark modern web traffic performance accurately. To support these intense workloads, the system has upgraded to the 6.18 kernel. This underlying OS update provides massive improvements in long-term stability during heavy stress testing, ensuring that multi-week capacity tests run flawlessly without memory degradation.

Build Confidence Through Real-World Testing

The gap between a perfect lab and a real-world deployment is where downtime lives. By continuously evolving the LANforge platform to meet the demands of Wi-Fi 7, advanced TR-398 standards, and enterprise-grade deployment, Candela Technologies ensures that ISPs and network engineers have the visibility and confidence they need to deliver exceptional service.

Ready to build a resilient, high-performance network testbed? Explore Candela Technologies solutions and contact our team today to discuss your lab requirements.

Beyond the “Perfect” Lab: Simulating Real-World Network Chaos Before Deployment

It is the classic IT paradox: your application performed flawlessly in the staging lab, but the moment it was deployed to the branch office or the factory floor, the trouble tickets started piling up.

The disconnect usually isn’t in the code or the hardware configuration; it is in the network conditions. In the pristine environment of a lab, latency is near-zero, packets never drop, and bandwidth is plentiful. In the real world, however, networks are hostile environments filled with jitter, congestion, and varying link qualities.

If you aren’t validating your technology against these imperfect conditions before deployment, you are effectively testing in production—a risk that modern enterprises can no longer afford.

What is Network Impairment Emulation?

Network impairment emulation is the practice of bridging the gap between “lab perfection” and “real-world chaos.”

Unlike a simulator, which uses mathematical models to predict behavior, an emulator is an active device placed “inline” between two points in your test network. It passes live traffic but acts as a programmable bottleneck, selectively injecting faults such as:

  • Packet Loss: Dropping 0.5% of packets to mimic a poor fiber splice or a congested switch.
  • Latency & Jitter: delaying packets to simulate satellite links or 5G backhaul instability.
  • Reordering & Corruption: Flipping bits or arriving out-of-sequence to test error-correction logic.

By introducing these specific, reproducible flaws, engineers can “break” the network in a controlled manner to ensure their applications recover gracefully.

The Two Approaches: Software vs. Hardware

Choosing the right tool often comes down to the Software vs. Hardware trade-off:

  • Software-Defined (e.g., Candela): These solutions prioritize flexibility and scale. They run on standard OS kernels, allowing for massive complexity—simulating thousands of clients or entire mesh topologies. The trade-off is often absolute precision at very high speeds (40G+), where OS overhead can introduce unintended jitter.
  • Hardware-Based (e.g., Aukua): These use FPGA (Field-Programmable Gate Array) silicon to process packets at wire speed. They offer nanosecond precision and zero “self-induced” latency. The trade-off is usually a fixed port count and higher cost per port.

At Telnet Networks, we rely on two primary partners to cover this spectrum: Candela Technologies and Aukua Systems.

Candela Technologies: Wi-Fi Mastery at Scale

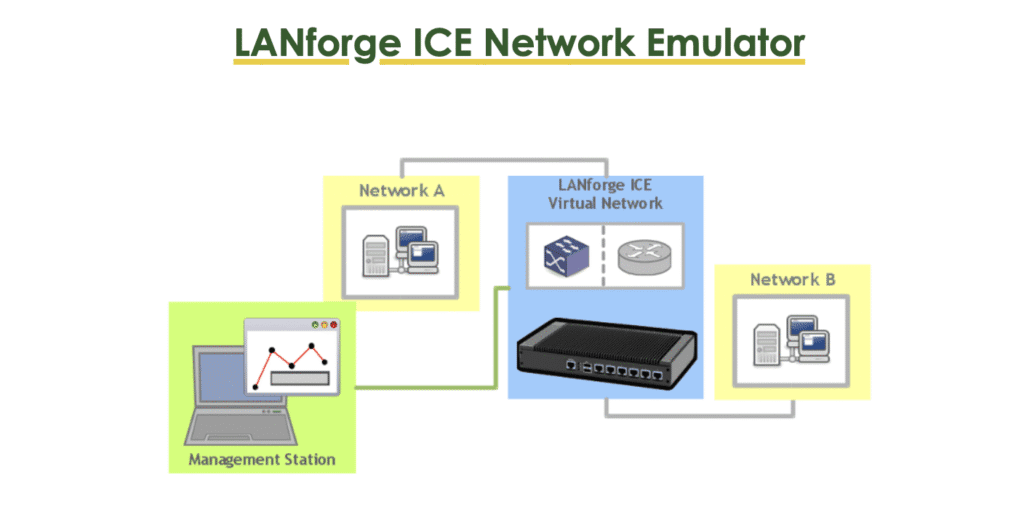
Candela Technologies and their LANforge platform are the industry standard for environments that require scale and complexity, particularly in wireless networking. They don’t just emulate the wire; they emulate the clients on the wire.

Why Candela?

Candela shines when you need to answer the question: “What happens if 500 users try to stream video while roaming between Access Points?”

Industry-Specific Capabilities:

  • High-Density Wi-Fi Emulation: LANforge can simulate hundreds of virtual stations (vSTAs) using a single physical radio. This is critical for testing high-density deployments like stadiums or campuses without buying hundreds of physical phones and laptops.
  • TR-398 & RFC 2544 Testing: Candela offers automated scripts for standard performance benchmarking, including the Broadband Forum’s TR-398 standard for Wi-Fi performance.
  • “Home in a Box”: For ISP and consumer electronics testing, Candela provides RF enclosures combined with programmable attenuators. This setup allows you to physically isolate an Access Point and programmatically simulate a user walking away from the router—moving from strong signal to weak signal—to validate roaming handoffs and rate adaptation.

Aukua Systems: Extreme Precision for Ethernet Test & Validation

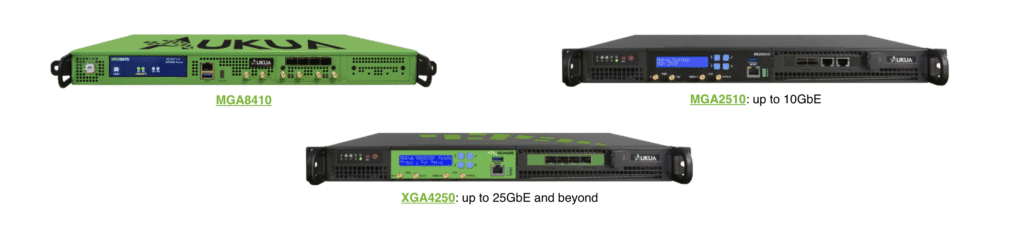
Aukua Systems focuses on the other end of the spectrum: precision, visibility, and speed. Their MGA and XGA platforms are engineered for environments where a microsecond of delay can mean system failure.

Why Aukua?

Aukua offers a unique “3-in-1” architecture. A single appliance can operate as a Traffic Generator, a Network Impairment Emulator, or an Inline Protocol Analyzer. This versatility is unmatched for troubleshooting: you can impair a link and immediately capture the traffic to see exactly how the protocol failed, all from one interface.

Notable Industry-Specific Capabilities:

  • Automotive Ethernet: As cars become data centers on wheels, testing the internal network is critical. Aukua supports specific automotive standards like 100/1000BASE-T1, allowing engineers to inject faults into ADAS (driver assistance) sensor networks to ensure safety systems don’t crash during a voltage spike or packet drop.
  • 5G O-RAN & Fronthaul: In 5G Open RAN environments, timing is everything. Aukua provides nanosecond-accurate latency measurements and can impair specific protocol messages (like PTP synchronization packets) while letting user data pass through. This allows telecom engineers to stress-test the rigorous timing requirements of 5G fronthaul links.

Summary: Which Tool is Right for You?

If your testing involves complex topologies, Wi-Fi mesh networks, or scaling to thousands of clients, Candela Technologies offers the scriptable, software-defined flexibility you need.

If your focus is on high-speed Ethernet (up to 100G), Automotive compliance, or mission-critical 5G timing, Aukua Systems delivers the hardware-based precision required to validate those strict standards.

Don’t leave your deployment to chance. Whether you need to simulate a noisy Wi-Fi environment or a jittery trans-Atlantic fiber link, Telnet Networks can help you architect the right test solution.

Contact our team today to discuss your lab requirements and see a demo of these platforms in action.

Precision, Visibility, and Validation: Optimizing 5G Open RAN with Aukua Systems

In the world of 5G and Open RAN (O-RAN), “good enough” testing simply doesn’t cut it. As networks disaggregate into Radio Units (RU), Distributed Units (DU), and Centralized Units (CU), the margins for error shrink to microseconds. The fronthaul interface is unforgiving, and interoperability between vendors is never guaranteed.

This is where Aukua Systems distinguishes itself. Unlike traditional, bloated test equipment, Aukua offers a nimble, hardware-based “3-in-1” architecture that combines a Network Impairment Emulator, Traffic Generator, and Inline Protocol Analyzer.

At Telnet Networks, we rely on Aukua to help our customers move from the lab to the live edge with confidence. Here is how Aukua’s XGA4250 platform is solving the specific challenges of O-RAN.

The Aukua Advantage: 3-in-1 Capability

Aukua’s core value proposition is versatility without sacrificing precision. In a single 1U chassis, engineers get three distinct tools required for O-RAN validation:

  1. Traffic Generation: To stress-test throughput and load.
  2. Impairment Emulation: To inject real-world chaos (delay, jitter, drops) to see if the network survives.
  3. Inline Capture & Analysis: To see exactly what is happening on the wire with nanosecond precision.

The XGA4250 for High-Speed Fronthaul & Midhaul

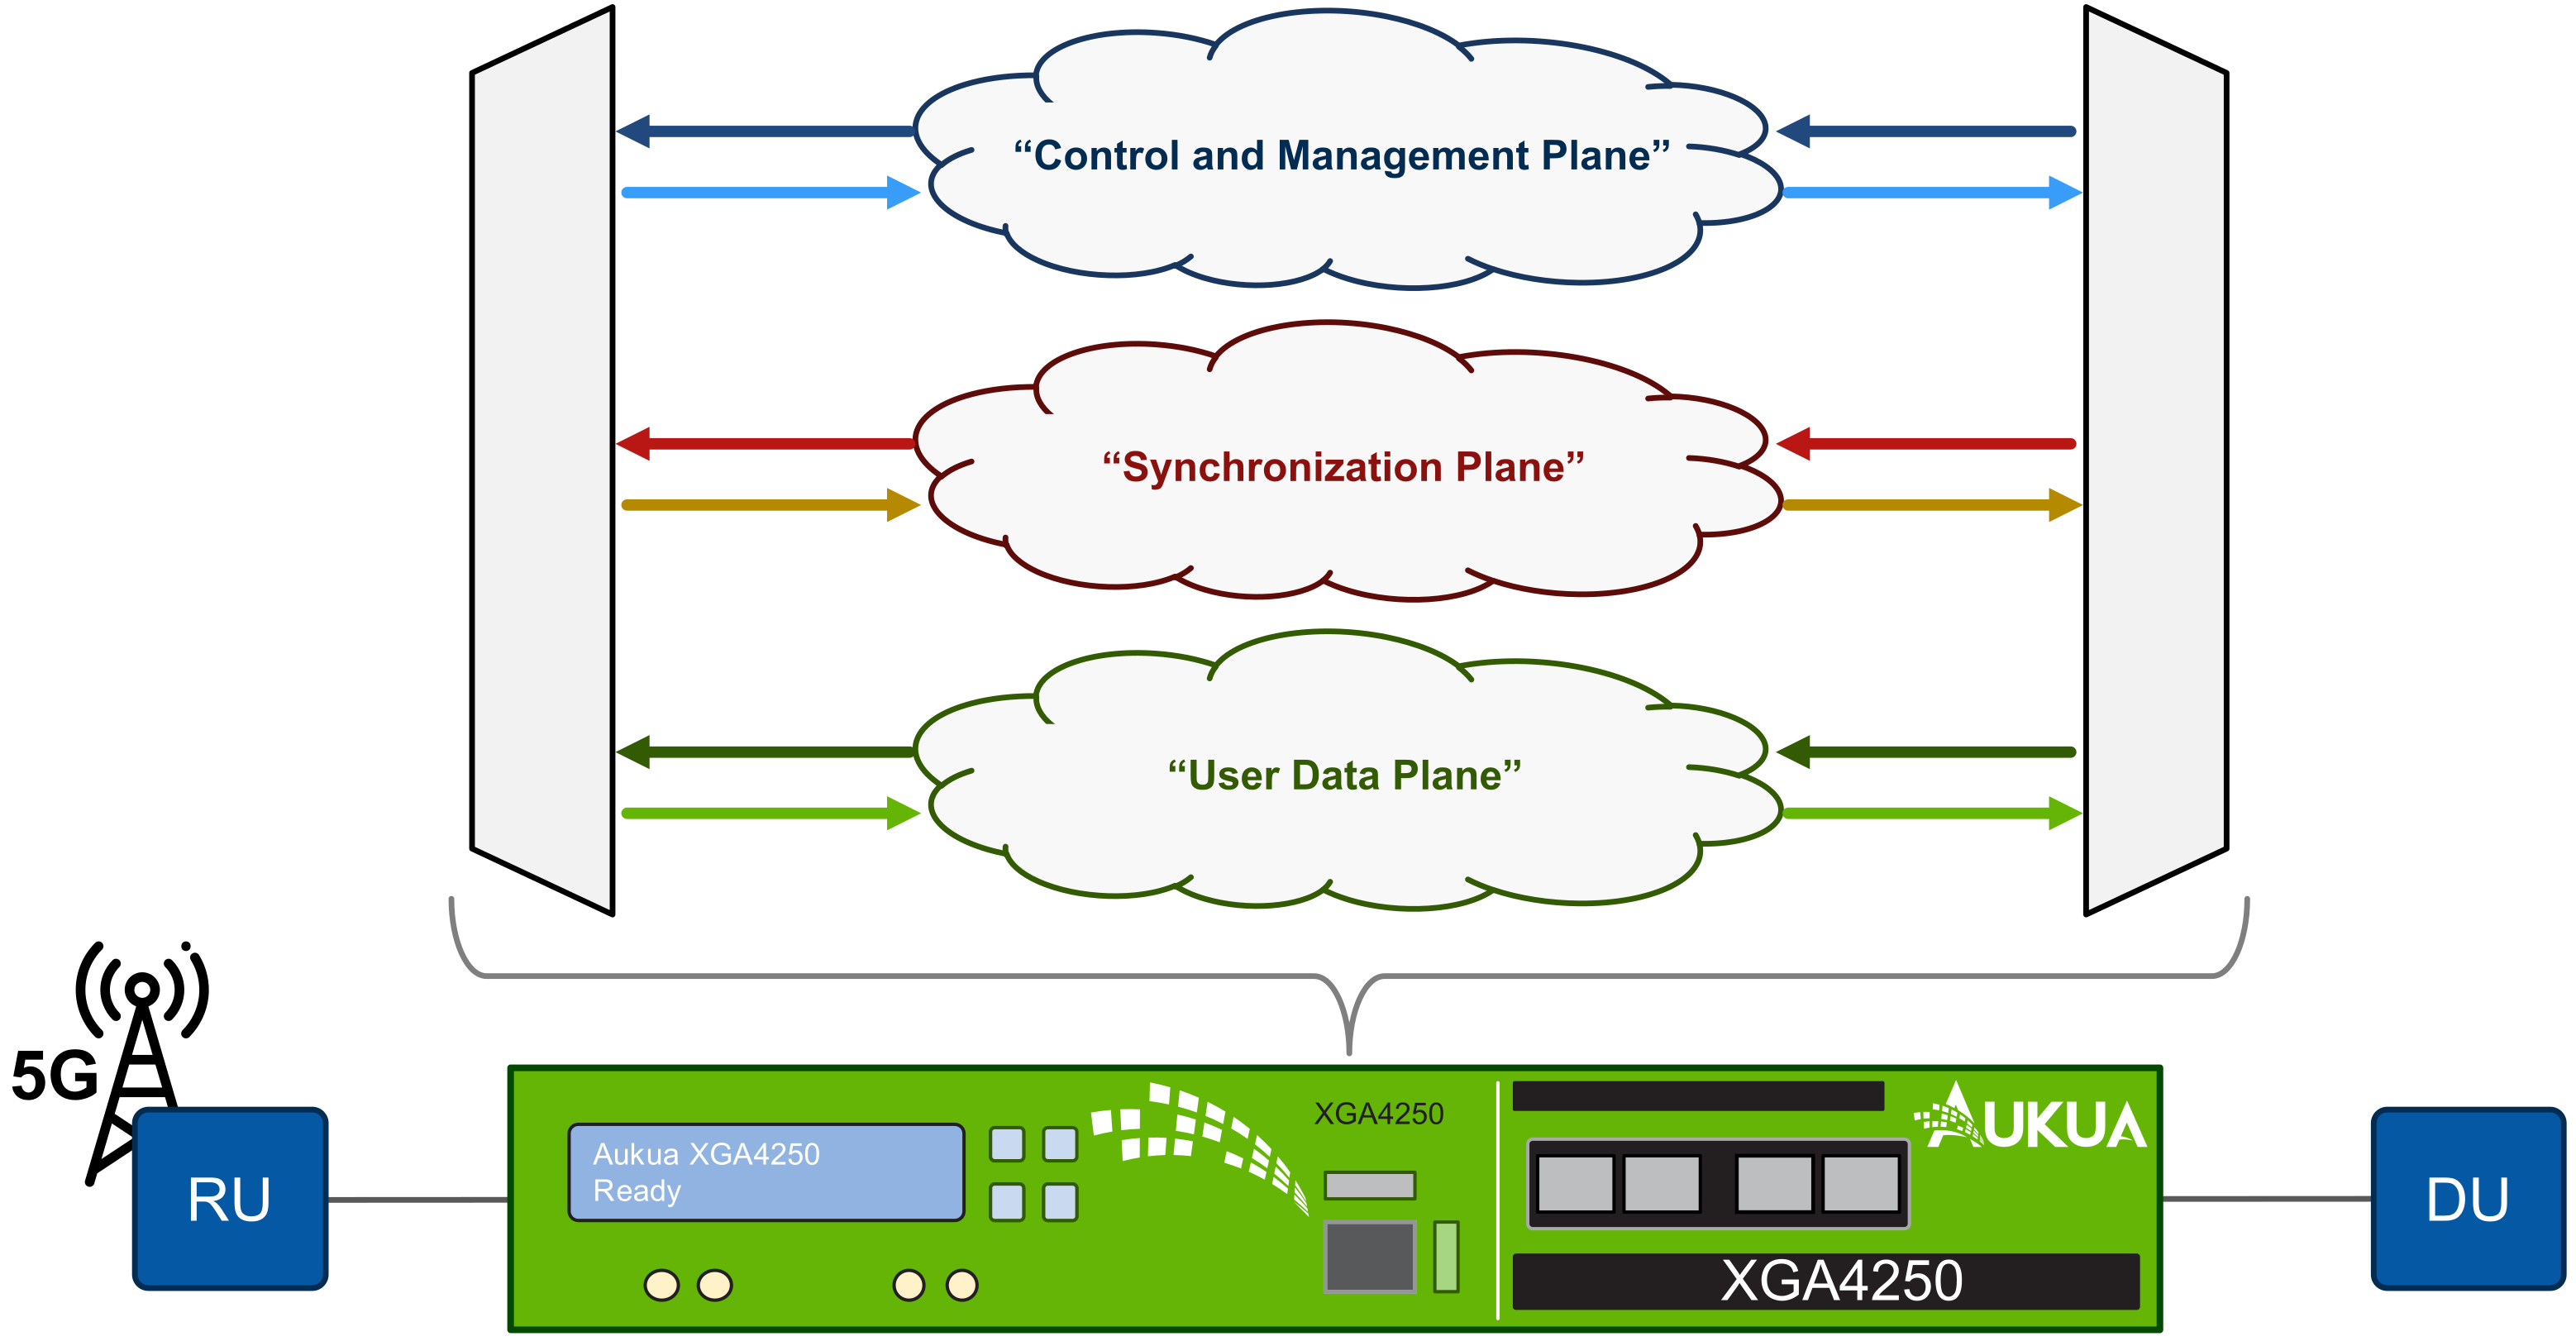
The XGA4250 is the industry workhorse for 25GbE O-RAN testing. It is specifically designed to handle the strict latency requirements of the 5G fronthaul and the buffering challenges of the midhaul.

Key 5G/O-RAN Use Cases:

  • Fronthaul Latency Validation (eCPRI/RoE): The link between the RU and DU is highly sensitive. The XGA4250 can emulate sub-millisecond delays with nanosecond precision, allowing you to verify that your fronthaul transport (e.g., eCPRI) meets the strict timing budget required by the O-RAN Alliance.
  • Midhaul Stress Testing: For the DU-to-CU link (Midhaul), typically running at 25GbE, the XGA4250 can emulate delays up to 20ms or more. This is critical for testing how the CU handles buffering and retransmissions when the DU is located miles away.
  • Protocol-Aware Impairment: The XGA4250 doesn’t just delay everything blindly. Its classifier technology allows you to target specific protocols—for example, you can delay eCPRI user-plane packets while letting PTP (Precision Time Protocol) and SyncE traffic pass through untouched. This ensures you are testing the application layer without breaking the network’s synchronization.

Download the Aukua 5G / O-RAN Solution Brief

Why the “Inline” Approach Matters

One of the biggest headaches in O-RAN is “finger-pointing” between vendors. When the DU and RU aren’t talking, who is at fault?

Aukua’s Inline Capture capability solves this. By sitting transparently between the network elements, the XGA and MGA platforms can capture traffic at line rate without disturbing the link.

  • Nanosecond Visibility: You can see exactly when a packet left the DU and when it arrived at the RU.
  • Layer 1 PCS Capture: Aukua goes deeper than standard tools, allowing you to capture Layer 1 Physical Coding Sublayer (PCS) bits. This is often where obscure interoperability issues hide, such as symbol errors that standard packet sniffers miss.

Get the 5G O-RAN Case Study

Ready to see the Aukua difference in your lab? Contact Telnet Networks today to schedule a demo of the XGA4250.

Everything You Need to Know About Flyaway Kits — And How to Build One for IT and OT Networks

In the world of network performance and cybersecurity, the ability to move fast can make the difference between a quick fix and a costly outage. That’s where flyaway kits come in — compact, portable, and ready-to-deploy network visibility and monitoring systems designed to travel anywhere you need them.

Whether you’re troubleshooting a remote site, validating a new deployment, or investigating an industrial network incident, a flyaway kit gives you everything you need to capture, analyze, and act on network data in the field.

In this guide, we’ll break down what a flyaway kit is, why they’re so valuable, and how to build the right one for enterprise IT visibility and OT/ICS network monitoring.

What Is a Flyaway Kit?

A flyaway kit is a self-contained, portable network monitoring and analysis solution built for rapid deployment in the field. Think of it as a mini NOC in a box — rugged, compact, and designed to help you gain instant visibility into live network traffic anywhere.

Each kit typically includes:

Flyaway kits are common in telecom, defense, utilities, and enterprise IT — anywhere fast, reliable diagnostics are critical.

Why a Flyaway Kit Matters

When a problem happens outside the lab or NOC, every minute counts. A well-built flyaway kit allows engineers to:

  • Diagnose problems faster – No waiting for remote access or site setup.
  • Collect accurate data – Direct packet capture and real-time visibility.
  • Reduce downtime – Identify and isolate performance or security issues on-site.
  • Work anywhere – From a factory floor to a remote substation or a pop-up site.

In short, flyaway kits bring reliable and fast acting visibility to where the problem is — not the other way around.

Design Priorities: Portability, Reliability, Compatibility

A well-engineered flyaway kit should emphasize:

  • Portability: Compact, lightweight, and quick to deploy — ideally airline carry-on size.
  • Reliability: Proven tools and set ups along with ruggedized hardware and power systems that work in challenging conditions if needed.
  • OT Compatibility: Passive, non-intrusive data access that respects operational safety.
  • Flexibility: Interchangeable SFPs, adapters, and tools to cover multiple network types.
  • Ease of Use: Familiar, pre-configured systems with dashboards ready to run out-of-the-box.

Building a Flyaway Kit for IT / Network Visibility & Packet Capture

If your focus is enterprise, service provider, or data center troubleshooting, your kit should deliver deep packet visibility, high-speed capture and real time analytics without compromising portability.

Typical Build

ComponentRoleRecommended Solutions
Network TAPs / AggregatorsCapture traffic safely and non-intrusivelyGarland Technology copper/fiber portable TAPs, Profitap Booster Aggregator
Capture & Analysis AppliancePerform packet capture, DPI, and traffic replayProfitap IOTA, Allegro Packets Multimeter 1000/3000 Series
Analysis SoftwareView, filter, and interpret trafficProfiShark, Wireshark, Allegro
Timing & SynchronizationEnsure accurate timestampsSafran GPS Sync or integrated modules
Ruggedized Laptop / Mini ServerPortable workstation for analysisToughbook or field laptop with SSD storage
Transport CaseProtect and organize equipmentPelican 1600/1650 series case

With this setup, engineers can perform on-site performance analysis, validate QoS, or capture forensic data in minutes — without impacting live services.

Building a Flyaway Kit for OT / ICS Networks

Industrial environments have unique challenges: legacy devices, sensitive protocols, and air-gapped networks that can’t tolerate disruptions.

An OT/ICS flyaway kit focuses on safe, passive monitoring and asset visibility — helping operators and cybersecurity teams understand what’s really happening on the network.

Typical Build

ComponentRoleRecommended Solutions
Industrial TAPsPassive access to ICS traffic (Modbus, DNP3, PROFINET)Garland Technology Industrial TAPs, Profitap Industrial Series
OT Visibility / Security ApplianceAnalyze OT protocols, assets, and anomaliesNozomi Guardian, Claroty Edge, or portable Allegro Multimeter for performance-level monitoring
Ruggedized Data CollectorCompact compute device with monitoring softwareIntel NUC or Advantech ARK with Nozomi or Zeek installed
Time SynchronizationTimestamp event data accuratelySafran GPS Sync or integrated modules
Visualization & ReportingDashboards for asset inventory and traffic baselinesNozomi Vantage or Claroty xDome
Rugged Field CaseShockproof, weather-resistant transportPelican Storm or Nanuk 935 case

This build allows operators to quickly deploy visibility in industrial or critical infrastructure networks — without interrupting production or compromising safety.

How Flyaway Kits Speed Up Diagnostics

Engineers who rely on flyaway kits report 50–70% faster mean time to resolution (MTTR) on field issues. Why? Because they can capture and analyze traffic instantly, without waiting for remote access, permissions, or central analysis.

A kit can be deployed at a remote branch, in an industrial facility, or during a network migration — and within minutes, provide insight into:

  • Where packets are being dropped
  • Which device is causing latency
  • Whether an issue is network or application-related

In industrial networks, they also help map assets, identify misconfigurations, and detect unauthorized devices — all without downtime.

Bringing It All Together

At Telnet Networks, we help organizations across Canada build customized flyaway kits that meet their exact operational and visibility requirements.
By combining solutions from trusted partners like Profitap, Allegro Packets, Garland Technology, Cubro, and Nozomi Networks, we deliver kits that are:

  • Portable and ruggedized
  • Fully interoperable across IT and OT environments
  • Preconfigured for rapid deployment and analysis

Whether you need a packet capture toolkit for IT troubleshooting or an industrial visibility system for OT security, we can help you design the right flyaway kit — ready to go wherever your network takes you.

Ready to Build Your Own Flyaway Kit?

Contact Telnet Networks to learn more about designing a custom, field-ready flyaway kits for your organization

Understanding Network Impairment Emulation: Building Resilient and High-Performance Networks

Modern networks are more complex than ever — spanning cloud, edge, and on-prem environments with applications that depend on consistent, high-performance connectivity. But real-world networks rarely behave perfectly. Congestion, latency, jitter, and packet loss can all affect application performance and user experience.

Network impairment emulation helps IT teams and network engineers understand how their systems behave under these imperfect conditions — before they impact production. Enabling teams to make adjustments to ensure performance or appropriate response to all conditions.

What Is Network Impairment Emulation?

Network impairment emulation allows you to replicate real-world network conditions in a controlled lab environment. Using purpose-built hardware or software, teams can introduce delays, drops, duplication, bandwidth limits, or other impairments to see how devices, applications, and protocols respond.

This controlled testing provides valuable insight into performance, resilience, and fault tolerance. It helps organizations validate new applications, optimize performance tuning, and ensure readiness for deployment across complex, distributed networks.

Why It Matters

For IT teams, the ability to predict performance issues before they occur is invaluable. Network impairment emulation provides:

  • Realistic testing of applications, devices, and systems under real-world network conditions.
  • Faster troubleshooting and validation before deployment, reducing risk and downtime.
  • Improved user experience through proactive optimization.
  • Greater confidence in network resilience, even across unpredictable WAN or cloud environments.

By understanding exactly how networks and applications behave under stress, teams can make better design decisions, strengthen reliability, and ensure seamless service delivery.

Telnet Networks’ Impairment Emulation Solutions

Telnet Networks partners with industry leaders Candela Technologies and Aukua Systems to deliver flexible, high-performance impairment and traffic emulation solutions that meet the needs of modern IT and test environments.

Candela Technologies Logo

Candela Technologies – Scalable, Software-Defined Testing

Candela’s network testing platforms, including the LANforge series, provide a versatile, software-defined approach to network traffic generation and impairment. LANforge enables users to simulate complex real-world network conditions — including congestion, jitter, latency, and loss — across wired, Wi-Fi, and WAN environments.

  • Highly configurable and scriptable for repeatable test automation.
  • Supports emulation of thousands of network nodes and realistic user behavior.
  • Ideal for testing performance across multi-vendor and multi-path environments.
Candela Lanforge Fire

Candela’s solutions are well-suited for enterprises, service providers, and vendors who need scalable and flexible network testbeds for development, validation, and performance benchmarking.

aukua logo

Aukua Systems – Precision Hardware Emulation for High-Speed Networks

Aukua delivers high-accuracy network impairment and traffic generation tools designed for high-performance Ethernet and storage networks. Their systems provide sub-microsecond precision and full line-rate performance up to 100 Gbps, ensuring test fidelity for today’s demanding applications.

  • Real-time network impairment and latency emulation for L1-L3 networks.
  • Integrated traffic generation and capture for detailed performance analysis.
  • Compact, easy-to-deploy form factors ideal for lab and field use.

Aukua’s solutions are trusted by semiconductor, equipment, and network solution developers to validate performance, reliability, and interoperability under real-world conditions.

Building Confidence Through Real-World Testing

Whether optimizing application delivery across distributed networks or validating the performance of next-generation network equipment, network impairment emulation provides the visibility and confidence IT teams need to deliver exceptional user experiences.

With solutions from Candela Technologies and Aukua Systems, available through Telnet Networks, organizations can test, measure, and optimize their networks with precision — before problems reach production.


Learn more about Telnet Networks’ network testing and performance validation solutions .

Troubleshooting Cheat Sheet: Layers 1-3

Any time you encounter a user complaint, whether regarding slow Internet access, application errors, or other issues that impact productivity, it is important to begin with a thorough understanding of the user’s experience.

Not sure where to begin?  User complaints usually fall into three categories: slow network, inability to access network resources, and application-specific issues.

Based upon the complaint being presented you need to understand the symptoms and then isolate the issue to the correct layer of the Open Systems Interconnection (OSI) model.

The following Troubleshooting Cheat Sheet shows the questions to ask with a typical slow network complaint.

What to Ask What it Means
What type of application is being used? Is it web-based? Is it commercial, or a homegrown application? Determines whether the person is accessing local or external resources.
How long does it take the user to copy a file from the desktop to the mapped network drive and back? Verifies they can send data across the network to a server, and allows you to evaluate the speed and response of the DNS server.
How long does it take to ping the server of interest? Validates they can ping the server and obtain the response time.
If the time is slow for a local server, how many hops are needed to reach the server? Confirms the number of hops taking place. Look at switch and server port connections, speed to the client, and any errors.

Quick OSI Layer Review

With these questions answered, working through the OSI model is a straightforward process. When dealing with the different layers, understanding how each layer delivers data and functions will impact how you would troubleshoot each layer.

Physical Layer

  • If it can blind or shock you, think Physical Layer
  • Defines physical characteristics of cables and connectors
  • Provides the interface between network and network devices
  • Describes the electrical, light, or radio data stream signaling

Data Link Layer

  • Converts signals into bits which become the packet data that everyone wants
  • Performs error detection and correction of the data streams
  • Manages flow and link control between the physical signaling and network
  • Constructs and synchronizes data frame packets

Network Layer

  • Controls logical addressing, routing, and packet generation
  • Carries out congestion control and error handling
  • Performs route monitoring and message forwarding

Assessing the Physical Layer

Generally speaking, Physical Layer symptoms can be classified into two groups of outage and performance issues. In most cases, investigating outage issues is the easiest place to begin, as it’s a matter of confirming the link light is out or that a box is not functioning. Additionally, validating equipment failure is a matter of replacing the cable or switch and confirming everything works.

Physical Layer issues are overlooked by people pinging or looking at NetFlow for the problem, when in reality it’s a Layer 1 issue caused by a cable, jack, or connector.

The next step in investigating Physical Layer issues is delving into performance problems. It’s not just dealing with more complex issues, but also having the correct tools to diagnose degraded performance. Essential tools in your tool box for testing physical issues are a cable tester for cabling problems, and a network analyzer or SNMP poller for other problems.

Assessing Physical Performance Errors

In diagnosing performance issues from a network analyzer, you’ll notice that there are patterns common with these errors, which are usually indicative of what’s causing the Physical Layer problem. These can be divided into intelligent and non-intelligent errors.

Intelligent Errors: An intelligent host is smashing into your network signal and corrupting the data.

Example: Overloaded WiFi network or a busy channel.

Non-Intelligent Errors: An outside entity causing noise that interferes with the signal or flow of data across the network.

Example: A microwave interfering with a WiFi signal.

Climbing Further up the Stack

Confirming performance problems, taking a systematic approach to troubleshooting, and understanding how communication occurs across the layers of the OSI model are key to slashing troubleshooting times and improving resolution accuracy.

Load Balancing Your Security Solution for Fun and Profit!

Maximizing the Value and Resiliency of Your Deployed Enterprise Security Solution with Intelligent Load Balancing

Correctly implementing your security solution in the presence of complex, high-volume user traffic has always been a difficult challenge for network architects. The data in transit on your network originates from many places and fluctuates with respect to data rates, complexity, and the occurrence of malicious events. Internal users create vastly different network traffic than external users using your publically available resources. Synthetic network traffic from bots has exceeded real users as the most prevalent creators of network traffic on the internet . How do you maximize your investment in a security solution while gaining the most value from the deployed solution? The answer is intelligent deployment through realistic preparation.

Let’s say that you have more than one point of ingress and egress into your network, and predicting traffic loads it is very difficult (since your employees and customers are global). Do you simply throw money at the problem by purchasing multiple instances of expensive network security infrastructure that could sit idle at times and then get saturated during others? A massive influx of user traffic could overwhelm your security solution in one rack, causing security policies to not be enforced, while the solution at the other point of ingress has resources to spare.

High speed inline security devices are not just expensive—the more features you enable on them the less network traffic they can successfully parse. If you start turning on features like sandboxing (which spawns virtual machines to deeply analyze potential new security events) you can really feel the pain.

Using a network packet broker with load balancing capability with multiple inline Next Generation Firewalls (NGFW) into a single logical solution, allows you to maximize your secruity investment.  To test the effectiveness we ran 4 scenerio’s using an advanced featured packet broker and load testing tools to see how effective this strategy is.

TESTING PLATFORM

Usung two high end NGFWs, we enabled nearly every feature (including scanning traffic for attacks, identifying user applications, and classifying network security risk based on the geolocation of the client) and load balanced the two devices using an advanced featured packet broker. Then using our load testing tools we created all of my real users and a deluge of different attack scenarios.  Below are the results of 4 testing scenerios

Scenario One: Traffic Spikes

Your 10GbE NGFW will experience inconsistent amounts of network traffic. It is crucial to be able effectively inforce security policies during such events. In the first test I created a baseline of 8Gbps of real user traffic, then introduced a large influx of traffic that pushed the overall volume to 14Gbps. The packet broker load balancer ensured that the traffic was split between the two NGFWs evenly, and all of my security policies were enforced.

Load Balancing Your Security Solution for Fun and Profit!

Figure 1: Network traffic spike

Scenario Two: Endurance Testing

Handling an isolated event is interesting, but maintaining security effectiveness over long periods of time is crucial for a deployed security solution. In the next scenario, I ran all of the applications I anticipated on my network at 11Gbps for 60 hours. The packet broker gave each of my NGFWs just over 5Gbps of traffic, allowing all of my policies to be enforced. Of the 625 million application transactions attempted throughout the duration of the test, users enjoyed a 99.979% success rate.

Load Balancing Your Security Solution for Fun and Profit!

Figure 2: Applications executed during 60 hour endurance test

Scenario Three: Attack Traffic

Where the rubber meets the road for a security solution is during an attack. Security solutions are insurance policies against network failure, data exfiltration, misuse of your resources, and loss of reputation. I created a 10Gbps baseline of the user traffic (described in Figure 2) and added a curveball by launching 7261 remote exploits from one zone to another. Had these events not been load balanced with the packet broker, a single NGFW might have experienced the entire brunt of this attack. The NGFW could have been overwhelmed and failed to inforce policies. The NGFW might have been under such duress mitigating the attacks that legitimate users would have been collateral damage of the NGFW attempting to inforce policies. The deployed solution performed excellently, mitigating all but 152 of my attacks.

Concerning the missed 152 attacks: the load testing tool library contains a comprehensive amount of undisclosed exploits. That being said, as with the 99.979% application success rate experienced during the endurance test, nothing is infallible. If my test worked with 100% success, I wouldn’t believe it and neither should you.

Load Balancing Your Security Solution for Fun and Profit!

Figure 3: Attack success rate

Scenario Four: The Kitchen Sink

Life would indeed be rosy if the totality of a content aware security solution was simply making decisions between legitimate users and known exploits. For my final test I added another wrinkle. The solution also had to deal with large volume of fuzzing to my existing deluge of real users and attacks. Fuzzing is the concept of sending intentionally flawed network traffic through a device or at an endpoint with the hopes of uncovering a bug that could lead to a successful exploitation. Fuzzed traffic can be as simple as incorrectly advertised packet lengths, to erroneously crafted application transactions. My test included those two scenarios and everything in between. The goal of this test was stability. I achieved this by mixing 400Mbps of pure chaos via load testing fuzzing engine, with Scenario Three’s 10Gbps of real user traffic and exploits. I wanted to make certain that my load-balanced pair of NGFWs were not going to topple over when the unexpected took place.

The results were also exceptionally good. Of the 804 million application transactions my users attempted, I only had 4.5 million go awry—leaving me with a 99.436% success rate. This extra measure of maliciousness only changed the user experience by increasing the failures by about ½ of a percent. Nothing crashed and burned.

Load Balancing Your Security Solution for Fun and Profit!

Figure 4: Application Success rates during the “Kitchen Sink” test

Conclusion

All four of the above scenarios illustrate how you can enhance the effectiveness of a security solution while maximizing your budget. However, we are only scratching the surface. What if you needed your security solution to be deployed in a High Availability environment? What if the traffic your network services expand? Setting up the packet broker to operate in HA or adding additional inline security solutions to be load balanced is probably the most effective and affordable way of addressing these issues.

Let us know if you are intrested in seeing a live demonstration of a packet broker load balancing attacks from secruity testing tool over multiple inline security solutions? We would be happy to show you how it is done.

Additional Resources:

Network Packet Brokers

CyPerf

Year-End Network Monitoring Assessment

Planning for the Future

As we approach the New Year, many organizations’ data centers and network configurations are in lockdown mode. Whether this is due to assuming a defensive posture against the onslaught of holiday ecommerce traffic, or an accommodation to vacationing staff, the situation provides network managers an opportunity to perform a year-end network monitoring assessment

Establish Future Goals, Identify Current Weaknesses and Make Sure Core Tasks and Goals Are Achieved

Q. How many locations will you need to monitor in the New Year?

If there are new server clusters or even new data centers in the works, be sure to plan accordingly, and ensure that your network monitoring tools will have visibility into those areas.  Network Taps can be used to incorporate more points of visibility for your existing monitoring tools within your growing network. Advanced appliances such as Network Packet Brokers (NPBs) can perform more sophisticated switching and filtering to optimize visibility within that network sprawl.

Q. What traffic will you be responsible for monitoring?

If you are providing network support, you need to understand immediately the nature, volume and security of the traffic flowing over your network. Is your organization planning to implement new applications or services on the network? Even the introduction or expansion of virtualization will require a monitoring plan that incorporates Virtual Taps. Additionally using advanced features on a packet broker like load balancing can extend the useful life of existing tools by sharing current traffic across a pool of devices.

Q. What new threats will the network face, and what preventative measures will you add?

The growing phenomena of advanced persistent threats (APTs) and directed attacks against network vulnerabilities demand a stronger response from security personnel. Up to 75 percent of devices within an organization’s network can contain a known security vulnerability. Many organizations deploy a defense-in-depth strategy with overlapping security tools to provide more robust security coverage. Be sure to schedule software updates for all of your network security tools, and make sure those security tools have total visibility of the traffic they are monitoring.

Q. What is your replacement plan for older equipment?

Take inventory of network equipment that have reached end-of-life, end-of-sale or end-of-support.. Budgeting for, and planning ahead for the obsolescence or re-tasking of these devices should be included in your plan for the coming year.

Q. What are your redundancy and failover plans?

One option for extending the useful life of your legacy monitoring tools is to utilize them as redundant tools in case of failover. Utilizing a bypass switch or high-availability modes in NPBs can make use of these tools in the event a primary device is put in maintenance mode, taken offline, or experiences a hardware failure. Consider assessing your older equipment on the basis of discarding the equipment entirely OR re-purposing it as a hot-standby.

Q. Have you included hardware/software maintenance in your annual budget?

Most hardware vendors offer annual maintenance and service plans for their devices. Renewing and maintaining these plans is critical to ensuring that you have access to the latest software updates. Additionally, should any of your devices experience hardware failure, advance replacement plans can get replacement equipment into your network as soon as possible.