“You cannot secure what you cannot see.”
It’s a mantra we come back to often, because it’s true. Your security tools are only ever as good as the data they receive. But in operational technology (OT) environments, that principle comes with a hard constraint that doesn’t exist in the IT world: the act of gaining visibility can’t introduce a new way into the network. Every monitoring connection you add to an industrial control system (ICS) is a potential path an attacker could travel in the wrong direction.
That tension, needing complete visibility while guaranteeing nothing flows back toward the plant floor, is exactly what data diodes were built to resolve. As IT and OT environments continue to converge, data diodes have moved from a niche defence-and-nuclear technology to a mainstream control for any organization serious about protecting critical infrastructure. Here’s a practical look at what they are, how they differ from the network TAPs you may already be using, and where they deliver the most value.
What Is a Data Diode?
A data diode is a purpose-built hardware device that allows network traffic to travel in one direction only. Think of it the way you’d think of its electronic namesake: current flows one way and is physically blocked from flowing the other. A network data diode does the same thing with packets. Data can leave a protected segment so it can be monitored, logged, or replicated, but nothing can be sent back in.
The critical word there is physically. A data diode doesn’t rely on a firewall rule, an access control list, or a software policy that could be misconfigured, disabled, or defeated. The one-way property is enforced in the hardware itself. Even if every other control in your stack were compromised, a data diode cannot carry traffic backward into the OT network. That deterministic, hardware-enforced guarantee is why diodes are trusted in the highest-security environments in the world, from nuclear facilities to national defence networks, and why they’re increasingly showing up in substations, water treatment plants, and manufacturing floors.
How Data Diodes Differ From Traditional Network TAPs
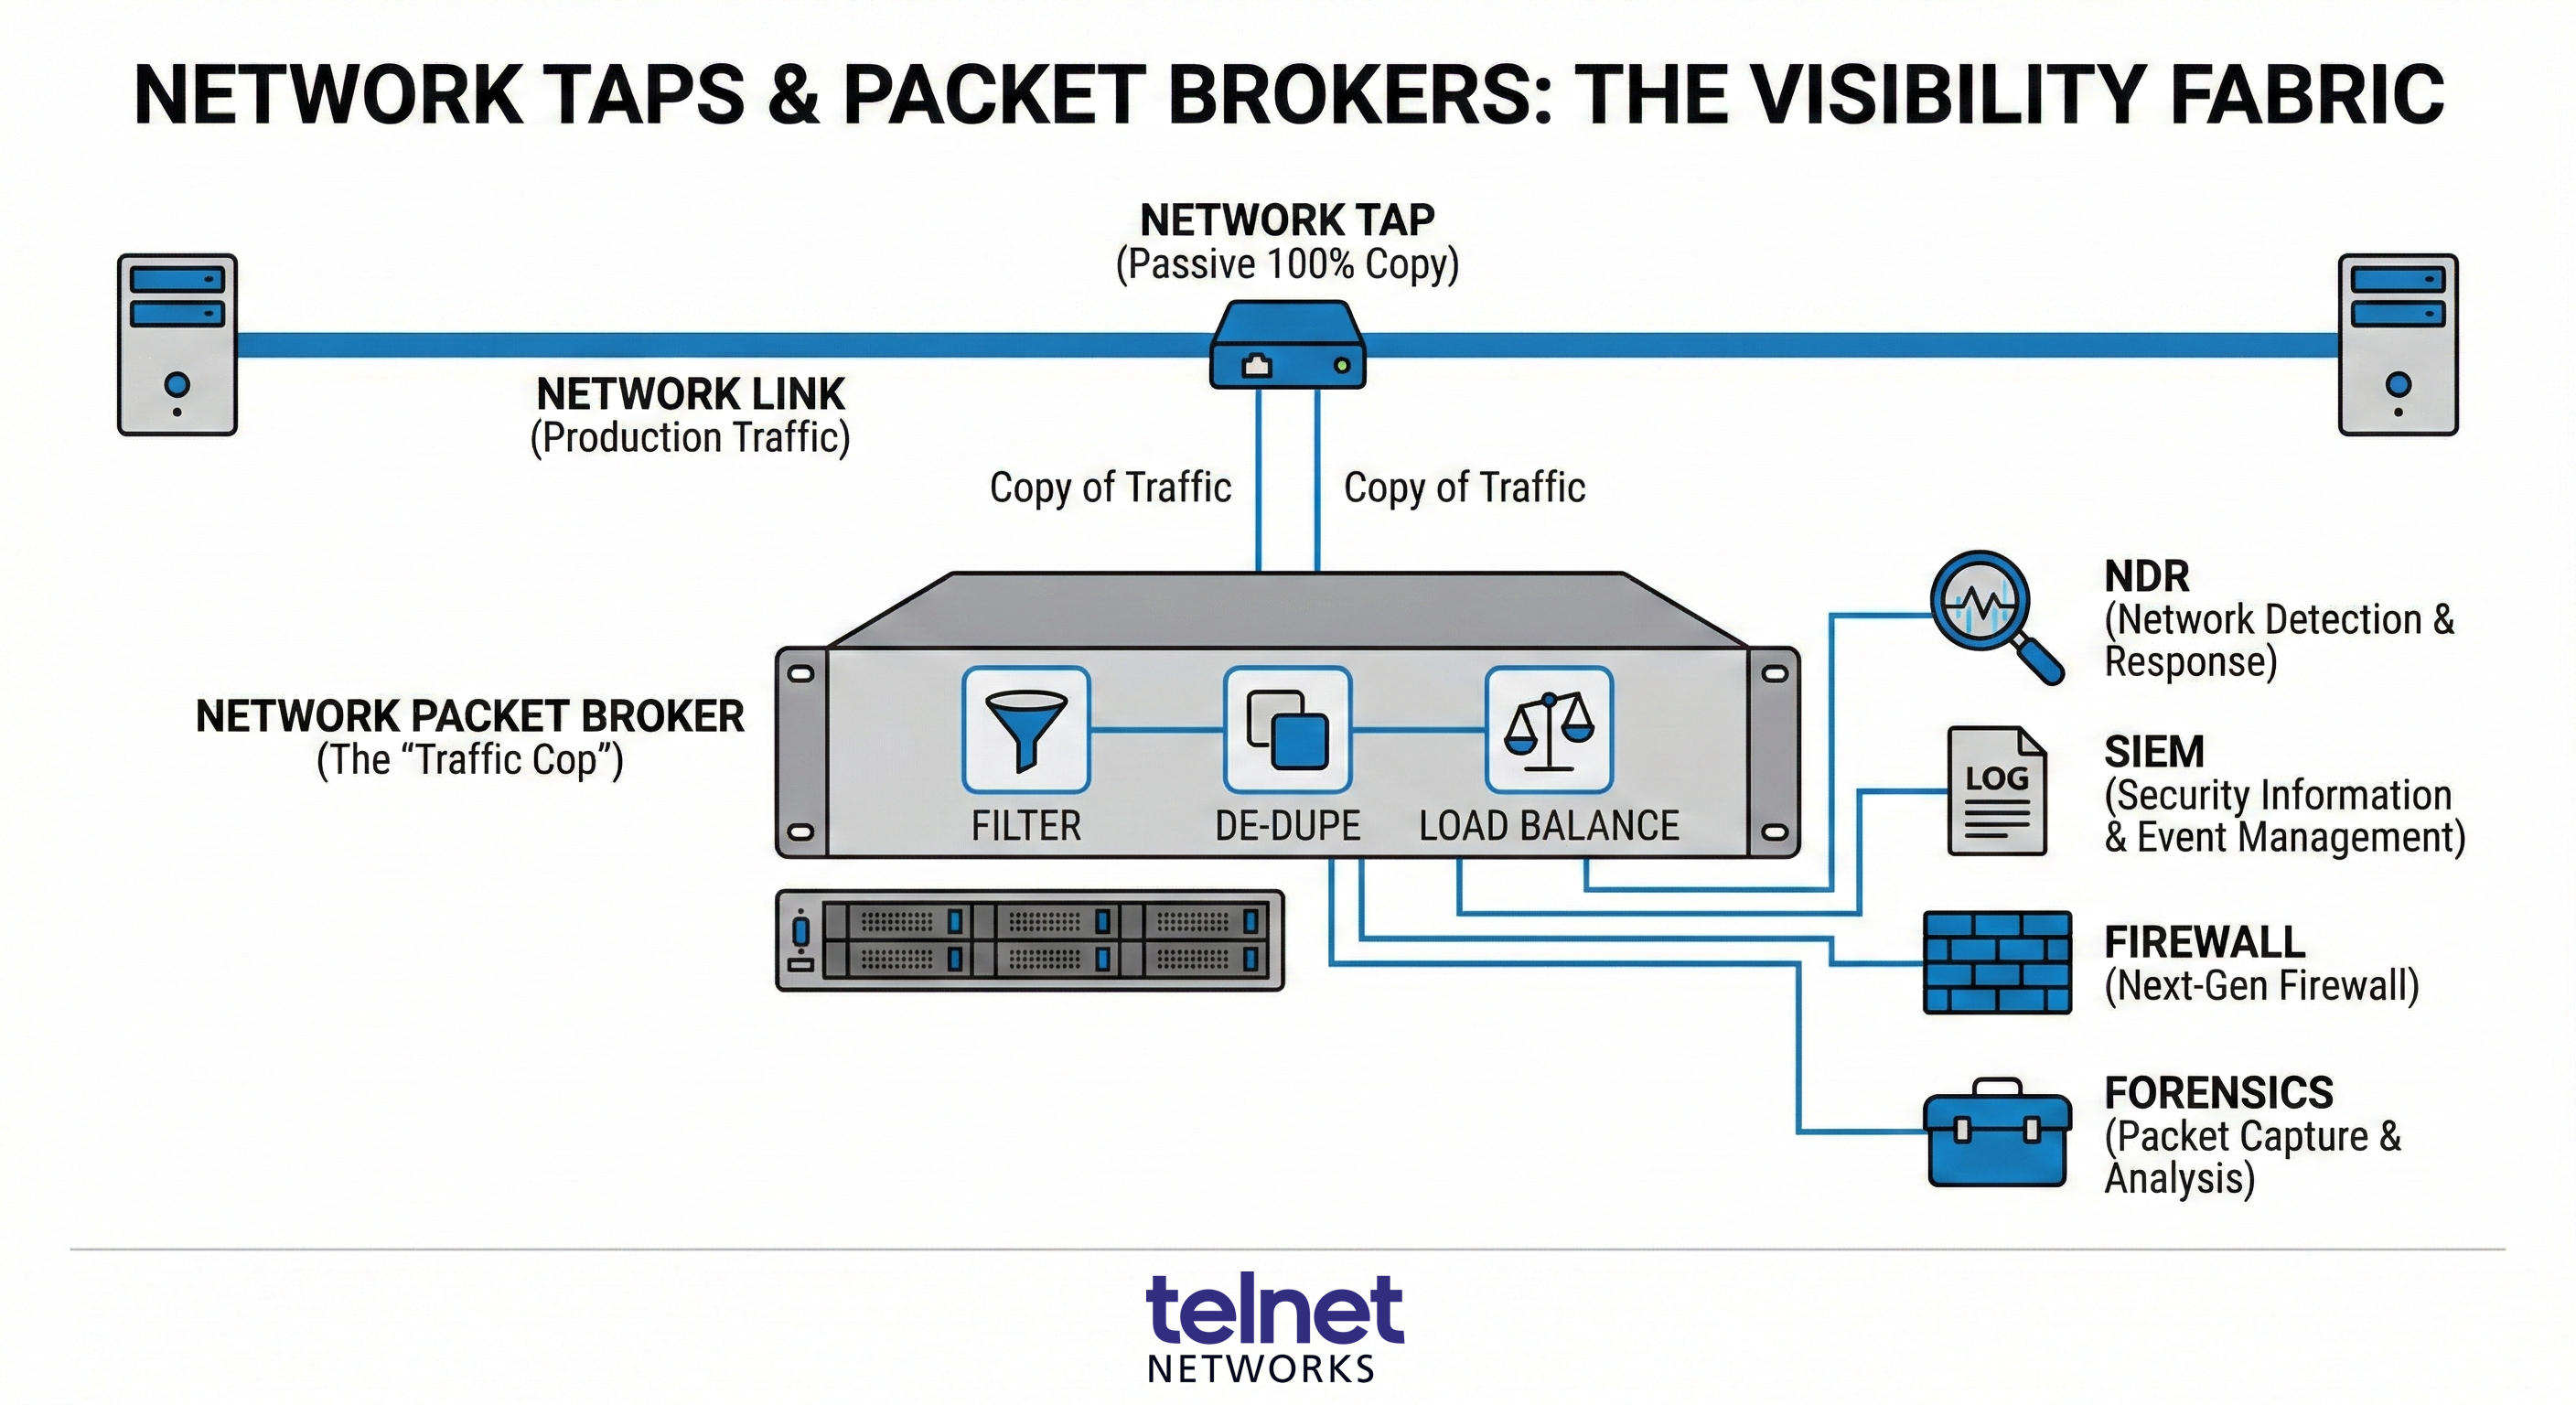
If you already run network TAPs (Test Access Points), it helps to be precise about where a data diode fits, because the two are related and often confused. A traditional network TAP is a visibility device: it sits in-line on a link, creates a complete, full-duplex copy of the traffic, and sends that copy to your monitoring and security tools. Unlike SPAN or port-mirroring on a switch, TAPs don’t drop packets under load or alter the timing of frames, and they keep working even if a tool is removed or loses power. The job of a TAP is faithful, complete duplication of what’s on the wire. (For a refresher, see our overview of network visibility solutions.)
A data diode is a security device. Its job isn’t just to copy traffic but to guarantee the direction traffic can travel, making absolutely certain the monitoring path can never become an injection path back into the control network. Some mirroring and monitoring connections are bidirectional by design, which quietly creates an opening: a tool plugged in to watch the network can, in principle, also talk to it. A diode closes that door permanently. Increasingly the two are combined in a single data diode TAP, which delivers a complete copy of traffic to your tools while physically preventing any packet from being sent back toward the live network. You get the fidelity of a TAP with the one-way assurance of a diode: full packet-level visibility, with a hardware guarantee that the visibility itself adds zero risk.
Why Data Diodes Are Essential in ICS Environments
For decades, OT systems were protected mostly by isolation, and that era is over. Digital transformation has connected ICS to corporate IT, cloud analytics, IoT sensors, and remote access in pursuit of efficiency and better data. The same connectivity that lets you stream substation telemetry to a central platform also widens the attack surface dramatically, and the legacy SCADA, PLCs, and IEDs running critical processes were never built to defend themselves, nor can they always be patched on an IT cadence without risking uptime or safety. (CISA keeps a useful primer in its Industrial Control Systems resources.)
This is exactly what data diodes were made for. When you need to get operational data out of a protected zone, whether to a SIEM, a historian, an intrusion detection system, or a cloud dashboard, without creating any way back in, a diode is the cleanest answer. It lets you embrace modern analytics while keeping the control network sealed off from inbound threats, lateral movement, and remote compromise, complementing the rest of a layered network and endpoint security program.
There’s also a growing compliance dimension, and for Canadian operators it is becoming concrete:
- NERC CIP governs the North American bulk electric system and is enforced in Canada through provincial regulators, so Canadian utilities are squarely in scope. Physically preventing inbound electronic access can simplify several requirements.
- Canada’s Critical Cyber Systems Protection Act (CCSPA), advancing through Bill C-8, will require designated operators in federally regulated energy, pipeline, transportation, telecom, finance, and nuclear sectors to run a cybersecurity program, manage supply-chain risk, and report incidents to the Communications Security Establishment, with significant penalties for non-compliance.
- CSA N290.7, the cyber security standard the Canadian Nuclear Safety Commission applies to nuclear facilities, alongside the U.S. NRC RG 5.71, both point to hardware-enforced one-way flow between security levels.
- IEC 62443 (international) and the EU NIS2 Directive round out the global picture, recognizing diodes as a valid isolation mechanism.
Software controls alone are hard to prove and easy to undermine. A hardware diode gives auditors something unambiguous: a device that, by physics, cannot pass traffic the wrong way. The Canadian Centre for Cyber Security publishes OT-specific guidance worth reviewing as your program matures.
How Data Diodes Strengthen OT Security Monitoring
The real value of a data diode shows up when you fold it into a broader visibility architecture. A few of the most common patterns:
Feeding security tools safely. Intrusion detection and OT-aware monitoring platforms, such as Nozomi, Claroty, or a Zeek/Suricata based solutions like Stamus Networks, need a complete copy of network traffic to baseline normal behaviour and flag anomalies. A data diode TAP delivers that full feed while guaranteeing the tool can never reach back into the control network. Your detection improves and your attack surface doesn’t. (Our post on enhancing OT security through network visibility covers the broader picture.)
One-way data replication to IT and the cloud. Plants routinely need to move historian data, process telemetry, and event logs from the OT side up to enterprise analytics, reporting, and cloud platforms. A diode lets that data flow outbound continuously while making inbound connections physically impossible.
Securing the SPAN connection. Many teams still rely on switch SPAN ports for visibility. Placing a diode between a SPAN port and the monitoring tool hardens that connection, removing the back-flow risk that bidirectional mirroring would otherwise create.
Monitoring air-gapped and segmented zones. Even networks that are nominally air-gapped need oversight. A diode extracts telemetry from an isolated segment for monitoring without ever bridging it to a less-trusted network, preserving the isolation while eliminating the blind spot.
When deployments grow, diodes pair naturally with network packet brokers, which aggregate, filter, and load-balance traffic so each tool receives exactly the data it needs. The result is an end-to-end visibility fabric: complete packet capture, intelligent distribution, and a hardware guarantee of one-way flow at the boundary.
A Closer Look at the Hardware: Garland and Profitap
The right diode depends on your media types, the number of SPAN or sensor connections you need to handle, and whether it lands in a clean data-centre rack or a rugged plant-floor cabinet. Two of our partners build purpose-built diode hardware spanning that whole range.
Garland Technology
Garland Technology pioneered the modern network TAP and offers a dedicated line of Hardware Data Diodes that connect SPAN and mirror ports safely to monitoring and security sensors, enforcing one-way flow through physical hardware separation inside the diode. Because they are unmanaged hardware with no IP or MAC address and no software to exploit, they install fast and carry no subscription, port, or feature fees. The portable CTAP-P1GCCREG regenerates two SPAN inputs to your sensors over copper at 10/100/1000M; the P1GCSSP adds copper-and-SFP flexibility with aggregation and regeneration of three SPAN inputs; and the 1U half-rack INT1G10CSASP is a high-density aggregator that consolidates eight copper SPAN inputs down to two SFP monitoring ports. AC, DC, rack, and DIN-rail options make the portables a practical fit for substations and other space-constrained OT cabinets. Garland’s Visibility 101 guide to hardware data diodes and OT/ICS network security pages go deeper.
Profitap
Profitap, based in Eindhoven, builds precision visibility hardware, and its Network Data Diodes provide deterministic, hardware-enforced unidirectional communication so monitoring tools can receive traffic while it stays physically impossible to send anything back into production. The flagship C1DD-1G delivers one-way copper visibility across all seven OSI layers with no packet loss, redundant power supplies for high availability, and a compact form factor that fits roughly a third of a rack unit. Profitap also builds data diode functionality directly into its Copper TAPs and the ProfiShark 1G portable capture device, preventing monitoring gear from injecting traffic back onto the link, while its ruggedized industrial and OT TAPs add DIN-rail mounting and DC power for the plant floor. That makes them a natural fit for teams working toward CCSPA or NERC CIP compliance. See our vendor spotlight on Profitap and Profitap’s ICS/OT network monitoring resources for more.
Where Data Diodes Deliver the Most Value
Data diodes pay off anywhere the consequences of an inbound compromise are severe and the need to extract data is constant. A few sectors stand out:
Electric utilities and substations. Modern smart-grid substations generate enormous volumes of real-time data that must reach central energy management and SCADA systems. Diodes let utilities ship that data upstream for monitoring and compliance while enforcing the unidirectional separation NERC CIP demands, keeping transmission and distribution control systems insulated from the corporate network. For Canadian operators answering to provincial regulators and, increasingly, the CCSPA, that hardware boundary is a clean way to demonstrate control.
Nuclear power and safety-critical systems. Few environments tolerate less risk, and here one-way flow isn’t just best practice, it’s regulated. Canadian nuclear operators work to CSA N290.7 under the Canadian Nuclear Safety Commission (and U.S. operators to NRC RG 5.71), both of which call for hardware-enforced separation between security levels. The same logic extends to safety-critical systems such as railway signalling networks.
Water and wastewater treatment. Often run by smaller municipal teams with limited cybersecurity resources, these facilities have become frequent targets. Diodes offer a low-maintenance, set-and-forget way to gain visibility into treatment processes without exposing the control systems that manage chemical dosing, pumps, and valves.
Oil, gas, and pipelines. Geographically dispersed assets and a tightening regulatory picture (including the CCSPA’s coverage of federally regulated pipelines) make one-way data export from remote sites particularly valuable. You get the telemetry you need at headquarters without opening a return path to field controllers.
Manufacturing and Industry 4.0. As factories connect production lines to MES, analytics, and cloud platforms, diodes let manufacturers feed OT data into IT systems for optimization and predictive maintenance while protecting production from ransomware and IT-side compromise.
Government, defence, and critical research. The original home of the data diode, where transferring data between networks of different classification levels without any possibility of back-flow is a foundational requirement.
A representative example ties it together. Picture a Canadian electric utility connecting dozens of substations to a central monitoring centre. Engineers want full packet visibility at each site to feed an OT intrusion detection platform, and they need substation data flowing to corporate analytics, all while staying inside NERC CIP scope. By deploying data diode TAPs at each substation, the utility gives its detection tools a complete, faithful copy of the traffic and streams telemetry northbound to the SOC, with the hardware guaranteeing that none of those monitoring paths can ever reach back into the control systems. Visibility goes up, audit scope gets simpler, and the attack surface stays flat.
Bringing It Together
Visibility and security used to feel like a trade-off in OT, where every tool you added to watch the network was another potential way in. Data diodes dissolve that trade-off, delivering the complete, packet-level visibility that modern threat detection and compliance demand while a simple law of physics ensures the visibility can never become a liability. Whether you’re hardening SPAN connections, feeding an OT detection platform, or designing one-way data export from a protected zone, the right combination of TAPs, packet brokers, and data diodes makes the difference, and that’s the kind of design work we do every day.
Ready to add secure, one-way visibility to your OT environment? Reach out to the experienced Telnet Networks sales and engineering team for a no-obligation consultation. We’ll walk through your specific environment, your compliance drivers, and the right diode and visibility architecture to get you there. Contact us »