Viavi Solutions Launches GigaStor Software Edition for Virtual and Cloud Environments

Viavi Solutions Launches GigaStor Software Edition for Virtual and Cloud Environments

Solution Delivers Fast and Accurate Troubleshooting and Assurance in Next Generation Network Architecture

(NASDAQ: VIAV) Viavi Solutions Inc. (“Viavi”) today announced it is expanding its portfolio of software-defined network test and monitoring solutions with the new GigaStor Software Edition to manage performance and user experience in virtual and cloud environments. The new software configurations, which Viavi is demonstrating at VMworld, allow network and server teams to capture and save 250 GB or 1 TB of continuous traffic to disk for in-depth performance and forensic analysis.

“IT teams are wasting a lot of time by only tracking virtual server and resource health,” said Charles Thompson, senior director of product management, Viavi Solutions. “These teams can often miss problems associated with applications within the hypervisor with such narrow vision. With GigaStor Software engineers now have the ability to see in real time and historically how users are experiencing applications and services within the virtual environment, saving time and end-user heartache.”

Without GigaStor’s insight, engineers could spend hours replicating a network error before they can diagnose its cause. GigaStor Software captures packet-data from within the virtual switching infrastructure without needing to push data into the physical environment. It can be deployed in any virtual host for the long-term collection and saving of packet-level data, which it can decode, analyze, and display. Additionally, it provides IT teams with greater accuracy and speed in troubleshooting by having all packets available for immediate analysis.

Utilizing the GigaStor Software and appliances, network teams can monitor and analyze all virtual datacenter traffic whether within a VMware ESX host or on 10 and 40 Gigabit Ethernet links. GigaStor Software is available today for purchase, and is being demonstrated during VMworld in San Francisco at Viavi Solutions booth #2235.

Thanks to Viavi for the article. 

External Availability Monitoring – Why it Matters

Remember the “good old days” when everyone that worked got in their car and drove to a big office building every day? And any application that a user needed was housed completely within the walls of the corporate datacenter? And partners / customers had to dial a phone to get a price or place an order? Well, if you are as old as I am, you may remember those days – but for the vast majority you reading this, you may think of what I just described as being about as common as a black and white TV.

The simple fact is that as the availability and ubiquity of the Internet has transformed the lives of people, it has equally (if not more dramatically) transformed IT departments.In some way this has been an incredible boon, for example, I can now download and install new software in a fraction of the time it used to take to purchase and receive that same software on CD’s (look it up kids).

Users can now login to almost any critical business application from anywhere there is a Wi-Fi connection. They can probably perform their job function to nearly 100% from their phone….in a Starbucks…. or on an airplane…..But of course, with all of the good, comes (some) of the bad – or at least difficult challenges for the IT staff whose job it is to keep all of those applications available to everyone , everywhere, all of the time. The (relatively) simple “rules” for IT monitoring need to be re-thought and extended for the modern work place. This is where External Availability Monitoring comes in.

We define External Availability Monitoring (EAM) as the process through which your critical network services and the applications that run over them are continuously tested from multiple test points which simulate real world geo-diversity and connectivity options. Simply put, you need to constantly monitor the availability and performance of any public facing services. This could be your corporate website, VPN termination servers, public cloud based applications and more.

This type of testing matters, because the most likely cause of service issues today is not call from Bob on the 3rd floor, but rather Jane who is currently in a hotel in South America and is having trouble downloading the latest presentation from the corporate intranet which she needs to deliver tomorrow morning.

Without a proactive approach to continuous service monitoring, you are flying blind as to issues that impact the global availability – and therefore operations- of your business.

So, how is this type of monitoring delivered? We think the best approach is to setup multiple types of tests such as:

  • ICMP Availability
  • TCP Connects
  • DNS Tests
  • URL Downloads
  • Multimedia (VoIP and Video) tests (from external agent to internal agent)
  • Customized application tests

These tests should be performed from multiple global locations (especially from anywhere your users commonly travel). This could even include work from home locations. At a base level, even a few test points can alert you quickly to availability issues.

More test points can increase the accuracy with which you can pinpoint some problems. It may be that the incident seems to be isolated to users in the Midwest or is only being seen on apps that reside on a particular cloud provider. The more diverse data you collect, the swifter and more intelligent your response can be.

Alerts should be enabled so that you can be notified immediately if there is an issue with application degradation, or “service down” situation. The last piece to the puzzle is to quickly be able to correlate these issues with underlying internal network or external service provider problems.

We see this trend of an “any application, anywhere, anytime” service model becoming the standard for IT departments large and small. With this shift comes an even greater need for continuous & proactive External Availability Monitoring.

External Availability Monitoring - Why it Matters

Thanks to NMSaaS for the article.

Infosim® Global Webinar Day – How to prevent – Or Recover From – a Network Disaster

Oh. My. God. This time it IS the network!

How to prevent – or recover from – a network disaster

Jason Farrer Join Jason Farrer, Sales Engineer with Infosim® Inc. for a Webinar and Live Demo on “How to prevent – or recover from – a network disaster”.Join Jason Farrer, Sales Engineer with Infosim® Inc. for a Webinar and Live Demo on “How to prevent – or recover from – a network disaster”.


This Webinar will provide insight into:

  • Why is it important to provide for a network disaster?
  • How to deal with network disaster scenarios [Live Demo]
  • How to prevent network corruption & enhance network security

Watch Now!

Infosim® Global Webinar Day August 27th, 2015

A recording of this Webinar will be available to all who register!
(Take a look at our previous Webinars here.)

Thanks to Infosim for the article.

The 3 Most Important KPI’s to Monitor On Your Windows Servers

Much like monitoring the heath of your body, monitoring the health of your IT systems can get complicated. There are potentially hundreds of data points that you could monitor, but I am often asked by customers to help them decide what they should monitor. This is mostly due to there being so many available KPI options that can be implemented.

However, once you begin to monitor a particular KPI, then to some degree you are implicitly stating that this KPI must be important (since I am monitoring it) and therefore I must also respond when the KPI creates an alarm. This can easily (and quickly) lead to “monitor sprawl” where you end up monitoring so many data point and generating so many alerts that you can’t really understand what is happening – or worse yet – you begin to ignore some alarms because you have too many to look at.

In the end, one of the most important aspects of designing a sustainable IT monitoring system is to really determine what the critical performance indicators are, and then focus on those. In this blog post, I will highlight the 3 most important KPI’s to monitor on your windows servers. Although, as you will see, these same KPI’s would be suited for any server platform.

1. Processor Utilization

Most monitoring systems have a statically defined threshold for processor utilization somewhere between 75% and 85%. In general, I agree that 80% should be the “simple” baseline threshold for core utilization.

However, there is more than meets the eye to this KPI. It is very common for a CPU to exceed this threshold for a short period of time. Without some consideration for the length of time that this mark is broken, a system could easily generate a large number of alerts that are not actionable by the response team.

I usually recommend a “grace period” of about 5 minutes before an alarm should be created. This provides enough time for a common CPU spike to return to an OK state, but is also short enough that when a real bottleneck occurs due to CPU utilization, the monitoring team is alerted promptly.

It is also important to take into consideration the type of server that you are monitoring. A well scoped out VM should in fact see high average utilization. In that case, it may be useful to also monitor a value like the total percentage interrupt time. You may want to alarm when total percentage interrupt time is greater than 10% for 10 minutes. This value, combined with the standard CPU utilization mentioned above can provide a simple but effective KPI for CPU health.

2- Memory Utilization

Similar to CPU, memory bottlenecks are usually considered to take place at around 80% memory utilization. Again, memory utilization spikes are common enough (especially in VM’s) that we want to allow for some time before we raise an alarm. Typically, memory utilization over 80-85% for 5 minutes is a good criteria to start with.

This can be adjusted over time as you get to understand the performance of particular servers or groups of servers. For example, Exchange servers typically have a different memory usage pattern compared to Web servers or traditional file servers. It is important to baseline these various systems and make appropriate deviations in the alert criteria for each.

The amount of paging on a server is also a memory related KPI which is important to track. If your monitoring system is able to track memory pages per second, then I recommend also including this KPI in your monitoring views. Together with standard committed memory utilization these KPI’s provide a solid picture of memory health on a server.

3- Disk Utilization

Disk Drive monitoring encompasses a few different aspects of the drives. The most basic of course is drive utilization. This is commonly measured as an amount of free disk space (and not as an amount of used disk space).

This KPI can should be measured both as a percentage of free space – 10% is the most common threshold I see – as well as an absolute value, for example 200MB free. Both of these metrics are important to watch and should have individual alerts associated with their capacity KPI. It is also key to understand that a system drive might need a different threshold as compared to nonsystem drives.

A second aspect of HDD performance is the KPI’s associated with the time it takes for disk reads and writes. This is commonly described as “average disk seconds per transfer” although you may see this described in other terms. In this case the hardware that is used greatly influences the correct thresholds for such a KPI, so I cannot make a recommendation here. However, most HDD manufacturers will provide a KPI for their drives that is appropriate. You can usually find information on the vendors website for your specific drives.

The last component of drive monitoring seems obvious, but I have seen many monitoring systems that unfortunately ignore it (usually because it is not enabled by default and nobody ever thinks to check) and that is pure logical drive availability. For example checking the availability on a server of the C:\ , D:\ and E:\ Drives (or whatever should exist). This is simple, but can be a lifesaver when a drive is lost for some reason and you want to be alerted quickly.

Summary:

In order to make sure that your Windows servers are fully operational, there are few really critical KPIs that I think you should focus on. By eliminating some of the “alert noise” you can make sure that important alerts are not lost.

Of course each server has some application / service functions that also need to be monitored. We will explore the best practices for server application monitoring in a further blog post.

http://www.telnetnetworks.ca/en/contact-us.html

Thanks to NMSaaS for the article. 

A Simple Solution To Combatting Virtual Data Center Blind Spots

Blind spots are a long-established threat to virtual data centers. They are inherent to virtual machine (VM) usage and technology due to the nature of VMs, lack of visibility for inter- and intra-VM data monitoring, the typical practices around the use of VM’s, and the use of multiple hypervisors in enterprise environments.

Virtual machines by their nature hide inter- and intra-VM traffic. This is because the traffic stays within in a very small geographic area. As I mentioned in a previous blog, Do You Really Know What’s Lurking in Your Data Center?, Gartner Research found that 80% of VM traffic never reaches the top of the rack where it can be captured by traditional monitoring technology. This means that if something is happening to that 80% of your data (security threat, performance issue, compliance issue, etc.), you’ll never know about it. This is a huge area of risk.

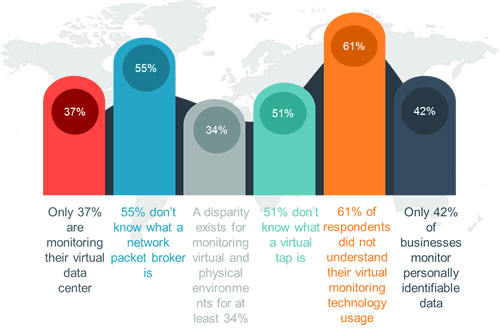
In addition, an Ixia conducted market survey on virtualization technology released in March 2015, exposed a high propensity for data center blind spots to exist due to typical data center practices. This report showed that there was probably hidden data, i.e. blind spots, existing on typical enterprise data networks due to inconsistent monitoring practices, lack of monitoring practices altogether in several cases, and the typical lack of one central group responsible for collecting monitoring data.

For instance, only 37% of the respondents were monitoring their virtualized environment with the same processes that they use in their physical data center environments, and what monitoring was done usually used less capabilities in the virtual environment. This means that there is a potential for key monitoring information to NOT be captured for the virtual environment, which could lead to security, performance, and compliance issues for the business. In addition, only 22% of business designated the same staff to be responsible for monitoring and managing their physical and virtual technology monitoring. Different groups being responsible for monitoring practices and capabilities often leads to inconsistencies in data collection and execution of company processes.

The survey further revealed that only 42% of businesses monitor the personally identifiable information (PII) transmitted and stored on their networks. At the same time, 2/3 of the respondents were running critical applications across within their virtual environment. Mixed together, these “typical practices” should definitely raise warning signs for IT management.

Additional research by firms like IDC and Gartner are exposing another set of risks for enterprises around the use of multiple hypervisors in the data center. For instance, the IDC Virtualization and the Cloud 2013 study found that 16% of customers had already deployed or were planning to deploy more than one hypervisor. Another 45% were open to the idea in the future. In September 2014, another IDC market analysis stated that now over half of the enterprises (51%) have more than one type of hypervisor installed. Gartner ran a poll in July 2014 that also corroborated that multiple hypervisors were being used in enterprises.

This trend is positive, as having a second hypervisor is a good strategy for an enterprise. Multiple hypervisors allow you to:

  • Negotiate pricing discounts by simply having multiple suppliers
  • Help address corporate multi-vendor sourcing initiatives
  • Provide improved business continuity scenarios for product centric security threats

But it is also very troubling, because the cons include:

  • Extra expenses for the set-up of a multi-vendor environment
  • Poor to no visibility into a multi-hypervisor environment
  • An increase in general complexity (particularly management and programming)
  • And further complexities if you have advanced data center initiatives (like automation and orchestration)

One of the primary concerns is lack of visibility. With a proper visibility strategy, the other cons of a multi-hypervisor environment can be either partially or completely mitigated. One way to accomplish this goal is to deploy a virtual tap that includes filtering capability. The virtual tap allows you the access to all the data you need. This data can be forwarded on to a packet broker for distribution of the information to the right tool(s). Built-in filtering capability is an important feature of the virtual tap so that you can limit costs and bandwidth requirements.

Blind spots that can create the following issues:

  • Hidden security issues
  • Inadequate access to data for trending
  • Inadequate data to demonstrate proper regulatory compliance policy tracking

Virtual taps (like the Ixia Phantom vTap) address blind spots and their inherent dangers.

If the virtual tap is integrated into a holistic visibility approach using a Visibility Architecture, you can streamline your monitoring costs because instead of having two separate monitoring architectures with potentially duplicate equipment (and duplicate costs), you have one architecture that maximizes the efficiency of all your current tools, as well any future investments. When installing the virtual tap, the key is to make sure that it installs into the Hypervisor without adversely affecting the Hypervisor. Once this is accomplished, the virtual tap will have the proper access to inter and intra-VMs that it needs, as well as the ability to efficiently export that information. After this, the virtual tap will need a filtering mechanism so that exported data can be “properly” limited so as not to overload the LAN/WAN infrastructure. The last thing you want to do is to cause any performance problems to your network. Details on these concepts and best practices are available in the whitepapers Illuminating Data Center Blind Spots and Creating A Visibility Architecture.

As mentioned earlier, a multi-hypervisor environment is now a fact for the enterprise. The Ixia Phantom Tap supports multiple hypervisors and has been optimized for VMware ESX and kernel virtual machine (KVM) environments. KVM is starting to make a big push into the enterprise environment. It has been part of the Linux kernel since 2007. According to IDC, shipments of the KVM license were around 5.2 million units in 2014 and they expect that number to increase to 7.2 million by 2017. A lot of the KVM ecosystem is organized by the Open Virtual Alliance and the Phantom vTap supports this recommendation.

To learn more, please visit the Ixia Phantom vTap product page, the Ixia State of Virtualization for Visibility Architectures 2015 report or contact us to see a Phantom vTap demo!

Additional Resources:

Ixia Phantom vTap

Ixia State of Virtualization for Visibility Architectures 2015 report

White Paper: Illuminating Data Center Blind Spots

White Paper: Creating A Visibility Architecture

Blog: Do You Really Know What’s Lurking in Your Data Center?

Solution Focus Category

Network Visibility

Thanks to Ixia for the article.

The First 3 Steps To Take When Your Network Goes Down

Whether it is the middle of the day, or the middle of the night nobody who is in charge of a network wants to get “that call”. There is a major problem and the network is down. It usually starts with one or two complaints “hey, I can’t open my email” or “something is wrong with my web browser” but those few complaints suddenly turn into many and you suddenly you know there is a real problem. What you may not know, is what to do next.

In this blog post, I will examine some basic troubleshooting steps that every network manager should take when investigating an issue. Whether you have a staff of 2 or 200, these common sense steps still apply. Of course, depending on what you discover as you perform your investigation, you may need to take some additional steps to fully determine the root cause of the problem and how to fix it.

Step 1. Determine the extent of the problem.

You will need to try and pinpoint as quickly as possible the scope of the issue. Is it related to a single physical location like just one office, or is it network wide including WAN’s and remote users. This can provide valuable insight into where to go next. If the problem is contained within a single location, then you can be pretty sure that the cause of the issue is also within that location (or at the very least that location plus any uplink connections to other locations).

It may not seem intuitive but if the issue is network wide with multiple affected locations, then sometimes this can really narrow down the problem. It probably resides in the “core” of your network because this is usually the only place that can have an issue which affects such a large portion of your network. That may not make it easier to fix, but it generally does help with identification.

If you’re lucky you might even be able to narrow this issue down even further into a clear segment like “only wireless users” or “everything on VLAN 100” etc. In this case, you need to jump straight into deep dive troubleshooting on just those areas.

Step 2. Try to determine if it is server/application related or network related.

This starts with the common “ping test”. The big question you need to answer is, do my users have connectivity to the servers they are trying to access, but (for some reason) cannot access the applications (this means the problem is in the servers / apps) or do they not have any connectivity at all (which means a network issue).

This simple step can go a long way towards troubleshooting the issue. If there is no network connectivity, then the issue will reside in the infrastructure. Most commonly in L2/L3 devices and firewalls. I’ve seen many cases where the application of a single firewall rule is the cause if an entire network outage.

If there is connectivity, then you need to investigate the servers and applications themselves. Common network management platforms should be able to inform you of server availability including tests for service port availability, the status of services and processes etc. A widespread issue that happens all at once is usually indicative of a problem stemming from a patch or other update / install that was performed on multiple systems simultaneously.

Step 3. Use your network management system to pinpoint, rollback, and/or restart.

Good management systems today should be able to identify when the problem first occurred and potentially even the root cause of the issue (especially for network issues). You also should have backup / restore capabilities for all systems. That way, in a complete failure scenario, you can always fall back to a known good configuration or state. Lastly, you should be able to then restart your services or devices and restore service.

In some cases there may have been a hardware failure that needs to be addressed first before a device can come back online. Having spare parts or emergency maintenance contracts will certainly help in that case. If the issue is more complex like overloading of a circuit or system, then steps may need to be put in place to restrict usage until additional capacity can be added. With most datacenters running on virtualized platforms today, in many cases additional capacity for compute, and storage can be added in less than 60 minutes.

Network issues happen to every organization. Those that know how to effectively respond and take a step by step approach to troubleshooting will be able to restore service quickly.

I hope these three steps to take when your Network goes down was usefull, dont forget to subscribe for our weekly blogs.

The First 3 Steps To Take When Your Network Goes Down

Thanks to NMSaaS for the article.

The Top 3 Reasons Why Network Discovery is Critical to IT Success

Network discovery is the process of identifying devices attached to a network. It establishes the current state and health of your IT infrastructure.

It’s essential for every business due to the fact that without the visibility into your entire environment you can’t successfully accomplish even the basics of network management tasks.

When looking into why Network Discovery is critical to IT success there are three key factors to take into consideration.

1. Discovering the Current State & Health of the Infrastructure.

Understanding the current state and health of the network infrastructure is a fundamental requirement in any infrastructure management environment. What you cannot see you cannot manage, or even understand, so it is vital for infrastructure stability to have a tool that can constantly discover the state and health of the components in operation.

2. Manage & Control the Infrastructure Environment

  • Once you know what you have its very easy to compile an accurate inventory of the following:
  • The environment’s components provide the ability to track hardware.
  • To manage end-of-life and end‑of‑support.
  • The hardware threshold management (i.e. Swap-Out device before failure)
  • To effectively manage the estates operating systems and patch management.

3. Automate Deployment

Corporation’s today place a lot of emphasis on automation therefore, it is very important that when choosing a Network Discovery tool to operate your infrastructure environment, it can integrate seamlessly with your CRM system. Having a consistent view of the infrastructure inventory and services will allow repeatable and consistent deployment of hardware and configuration in order to automate service fulfillment and deployment.

If you’re not using network discovery tool don’t worry were offering the service for absolutely free, just click below and you will be one step closer to improving your network management system.

The Top 3 Reasons Why Network Discovery is Critical to IT Success

Thanks to NMSaaS for the article. 

Why Just Backing Up Your Router Config is the Wrong Thing To Do

One of the most fundamental best practices of any IT organization is to have a backup strategy and system in place for critical systems and devices. This is clearly needed for any disaster recovery situation and most IT departments have definitive plans and even practiced methodologies set in place for such an occurrence.

However what many IT pros don’t always consider is how useful it is to have backups for reasons other than DR and the fact that for most network devices (and especially routers), it is not just the running configuration that should be saved. In fact, there are potentially hundreds of smaller pieces of information that when properly backed up can be used for help with ongoing operational issues.

First, let’s take a look at the traditional device backup landscape, and then let’s explore how this structure should be enhanced to provide additional services and benefits.

Unlike server hard drives, network devices like routers do not usually fall within the umbrella backup systems used for mass data storage. In most cases a specialized system must be put in place for these devices. Each network vendor has special commands that must be used in order to access the device and request / download the configurations.

When looking at these systems it is important to find out where the resulting configurations will be stored. If the system is simply storing the data into an on-site appliance, then it also critical to determine if that appliance itself is being backup into an offsite / recoverable system otherwise the backup are not useful in a DR situation where the backup appliance may also be offline.

It is also important to understand how many backups your system can hold i.e. can you only store the last 10 backups, or maybe only everything in the last 30 days etc. are these configurable options that you can adjust based on your retention requirements? This can be a critical component for audit reporting, as well as when rollback is needed to a previous state (that may not just have been the last state).

Lastly, does the system offer a change report showing what differences exist between selected configurations? Can you see who made the changes and when?

In addition to the “must haves” explored above, I also think there are some advanced features that really can dramatically improve the operational value of a device / router backup system. Let’s look at these below:

  • Routers and other devices are more than just their config files. Very often they can provide output which describes additional aspects of their operation. To use the common (cisco centric) terminology, you can also get and store the output of a “show” command. This may contain critical information about the devices hardware, software, services, neighbors and more that could not be seen from just the configuration. It can be hugely beneficial to store this output as well as it can be used to help understand how the device is being used, what other devices are connected to it and more.
  • Any device in a network, especially a core component such as a router should conform to company specific policies for things like access, security etc. Both the main configuration file, as well as the output from the special “show” commands can be used to check the device against any compliance policy your organization has in place.
  • All backups need to run both on a schedule (we generally see 1x per day as the most common schedule) as well as on an ad-hoc basis when a change is made. This second option is vital to maintaining an up to date backup system. Most changes to devices happen at some point during the normal work day. It is critical that your backup system can be notified (usually via log message) that a change was made and then immediately launch a backup of the device – and potentially a policy compliance check as well.

Long gone are the days where simply logging into a router, getting the running configuration, and storing that in a text file is considered a “backup plan”. Critical network devices need to have the same attention paid them as servers and other IT systems. Now is a good time to revisit your router backup systems and strategies and determine if you are implementing a modern backup approach, as you can see its not just about backing up your router config.

b2ap3_thumbnail_6313af46-139c-423c-b3d5-01bfcaaf724b_20150730-133914_1.pngThanks to NMSaaS for the article.

New GigaStor Portable 5x Faster

Set up a Mobile Forensics Unit Anywhere

On June 22, Network Instruments announced the launch of its new GigaStor Portable 10 Gb Wire Speed retrospective network analysis (RNA) appliance. The new portable configuration utilizes solid state drive (SSD) technology to stream traffic to disk at full line rate on full-duplex 10 Gb links without dropping packets.

“For network engineers, remotely troubleshooting high-speed networks used to mean leaving powerful RNA tools behind, and relying on a software sniffer and laptop to capture and diagnose problems,” said Charles Thompson, chief technology officer for Network Instruments. “The new GigaStor Portable enables enterprises and service providers with faster links to accurately and quickly resolve issues by having all the packets available for immediate analysis. Additionally, teams can save time and money by minimizing repeat offsite visits and remotely accessing the appliance.”

Quickly Troubleshoot Remote Problems

Without GigaStor Portable’s insight, engineers and security teams may spend hours replicating a network error or researching a potential attack before they can diagnose its cause. GigaStor Portable can be deployed to any remote location to collect and save weeks of packet-level data, which it can decode, analyze, and display. The appliance quickly sifts through data, isolates incidents, and provides extensive expert analysis to resolve issues.

Part of the powerful Observer Performance Management Platform, the GigaStor Portable 10 Gb Wire Speed with SSD provides 6 TB of raw storage capacity, and includes the cabling and nTAP needed to install the appliance on any 10 Gb network and start recording traffic right away.

Forensic capabilities are an important part of any network management solution. Learn more about GigaStor Portable and how RNA can help protect the integrity of your data.

Thanks to Network Instruments for the article.

NMSaaS Webinar – Stop paying for Network Inventory Software & let NMSaaS do it for FREE.

Please join NMSaaS CTO John Olson for a demonstration of our free Network Discovery, Asset & Inventory Solution.

Wed, Jul 29, 2015 1:00 PM – 1:30 PM CDT

Do any of these problems sound familiar?

  • My network is complex and I don’t really even know exactly what we have and where it all is.
  • I can’t track down interconnected problems
  • I don’t know when something new comes on the network
  • I don’t know when I need upgrades
  • I suspect we are paying too much for maintenance

NMSaaS is here to help.

Sign up for the webinar NOW > > >

In this webinar you will learn that you can receive the following:

  • Highly detailed complimentary Network Discovery, Inventory and Topology Service
  • Quarterly Reports with visibility in 100+ data points including:
    • Device Connectivity Information
    • Installed Software
    • VM’s
    • Services / Processes
    • TCP/IP Ports in use
    • More…
  • Deliverables – PDF Report & Excel Inventory List

Thanks to NMSaaS for the article.