CVE-2015-5119 and the Value of Security Research and Ethical Disclosure

The Hacking Team’s Adobe Flash zero day exploit CVE-2015-5119, as well as other exploits, were recently disclosed.

Hacking Team sells various exploit and surveillance software to government and law enforcement agencies around the world. In order to keep their exploits working as long as possible, Hacking Team does not disclose their exploits. As such, the vulnerabilities remain open until they are discovered by some other researcher or hacker and disclosed.

This particular exploit is a fairly standard, easily weaponizable use-after-free—a type of exploit which accesses a pointer that points to already free and likely changed memory, allowing for the diversion of program flow, and potentially the execution of arbitrary code. At the time of this writing, the weaponized exploits are known to be public.

What makes this particular set of exploits interesting is less how they work and what they are capable of (not that the damage they are able to do should be downplayed: CVE-2015-5119 is capable of gaining administrative shell on the target machine), but rather the nature of their disclosure.

This highlights the importance of both security research and ethical disclosure. In a typical ethical disclosure, the researcher contacts the developer of the vulnerable product, discloses the vulnerability, and may even work with the developer to fix it. Once the product is fixed and the patch enters distribution, the details may be disclosed publically, which can be useful learning tools for other researchers and developers, as well as for signature development and other security monitoring processes. Ethical disclosure serves to make products and security devices better.

Likewise, security research itself is important. Without security research, ethical disclosure isn’t an option. While there is no guarantee that the researchers will find the exact vulnerabilities held secret by the likes of Hacking Team, the probability goes up as the number and quality of researches increases. Various incentives exist, from credit given by the companies and on vulnerability databases, to bug bounties, some of which are quite substantial (for instance, Facebook has awarded bounties as high as $33,500 at the time of this writing).

However some researchers, especially independent researchers, may be somewhat hesitant to disclose vulnerabilities, as there have been past cases where rather than being encouraged for their efforts, they instead faced legal repercussions. This unfortunately discourages security research, allowing for malicious use of exploits to go unchecked in these areas.

Even in events such as the sudden disclosure of Hacking Team’s exploits, security research was again essential. Almost immediately, the vendors affected began patching their software, and various security researchers developed penetration test tools, IDS signatures, and various other pieces of security related software as a response to the newly disclosed vulnerabilities.

Security research and ethical disclosure practices are tremendously beneficial for a more secure Internet. Continued use and encouragement of the practice can help keep our networks safe. Ixia’s ATI subscription program, which is releasing updates that mitigate the damage the Hacking Team’s now-public exploits can do, helps keep network security resilience at its highest level.

Additional Resources:

ATI subscription

Malwarebytes UnPacked: Hacking Team Leak Exposes New Flash Player Zero Day

Thanks to Ixia for the article

3 Steps to Configure Your Network For Optimal Discovery

All good network monitoring / management begins the same way – with an accurate inventory of the devices you wish to monitor. These systems must be on boarded into the monitoring platform so that it can do its job of collecting KPI’s, backing up configurations and so on. This onboarding process is almost always initiated through a discovery process.

This discovery is carried out by the monitoring system and is targeted at the devices on the network. The method of targeting may vary, from a simple list of IP addresses or host names, to a full subnet discovery sweep, or even by using an exported csv file from another system. However, the primary means of discovery is usually the same for all Network devices, SNMP.

Additional means of onboarding can (and certainly do) exist, but I have yet to see any full-featured management system that does not use SNMP as one of its primary foundations.

SNMP has been around for a long time, and is well understood and (mostly) well implemented in all major networking vendors’ products. Unfortunately, I can tell you from years of experience that many networks are not optimally configured to make use of SNMP and other important configuration options which when setup correctly will optimize the network for a more efficient and ultimately more successful discovery and onboarding process.

Having said that, below are 3 simple steps that should be taken, in order to help maximize your network for optimal discovery.

1) Enable SNMP

Yes it seems obvious to say that if SNMP isn’t enabled then it will not work. But, as mentioned before it still astonishes me how many organizations I work with that still do not have SNMP enabled on all of the devices they should have. These days almost any device that can connect to a network usually has some SNMP support built in. Most networks have SNMP enabled on the “core” devices like Routers / Switches / Servers, but many IT pros many not realize that SNMP is available on non- core systems as well.

Devices like VoIP phones and video conferencing systems, IP connected security cameras, Point of Sale terminals and even mobile devices (via apps) can support SNMP. By enabling SNMP on as many possible systems in the network, the ability to extend the reach of discovery and monitoring has grown incredibly and now gives visibility into the network end-points like never before.

2) Setup SNMP correctly

Just enabling SNMP isn’t enough – the next step is to make sure it is configured correctly. That means removing / changing the default Read Only (RO) community string (which is commonly set by default to “public”) to a more secure string. It is also best practice to use as few community strings as you can. In many large organizations, there can be some “turf wars” over who gets to set these strings on systems. The Server team may have one standard string and the network team has another.

Even though most systems will allow for multiple strings, it is generally best to try to keep these as consistent as possible. This helps prevent confusion when setting up new systems and also helps eliminate unnecessary discovery overhead on the management systems (which may have to try multiple community strings for each device on an initial discovery run). As always, security is important, so you should configure the IP address of the known management server as an allowed SNMP system and block any other systems from being allowed to run an SNMP query against your systems.

3) Enable Layer 2 discovery protocols

In your network, you want much deeper insight into not only what you have, but how it is all connected. One of the best way to get this information is to enable layer 2 (link layer) discovery abilities. Depending on the vendor(s) you have in your network, this may accomplished with a proprietary protocol like the Cisco Discovery Protocol (CDP) or it may be implemented in a generic standard like the Link Layer Discovery Protocol (LLDP). In either case, by enabling these protocols, you gain valuable L2 connectivity information like connected MAC addresses, VLAN’s, and more.

By following a few simple steps, you can dramatically improve the results of your management system’s onboarding / discovery process and therefore gain deeper and more actionable information about your network.

b2ap3_thumbnail_6313af46-139c-423c-b3d5-01bfcaaf724b.png

Thanks to NMSaaS for the article.

Infosim® Global Webinar Day July 30th, 2015 – The Treasure Hunt is On!

How to visualize the state of your network and service infrastructure to uncover the hidden treasures in your data

Infosim® Global Webinar Day July 30th, 2015 - The treasure hunt is on! Join Harald Höhn, Sea Captain and Senior Developer on a perilous treasure hunt on “How to visualize the state of your network and service infrastructure to uncover the hidden treasure in your data”.

This Webinar will provide insight into:

  • How to speed up your workflows with auto-generated Weather Maps
  • How to outline complex business processes with Weather Maps
  • How to uncover the hidden treasures in your data [Live Demo]

Infosim® Global Webinar Day July 30th, 2015 - The treasure hunt is on! But wait, there is more! We are giving away three treasure maps (Amazon Gift Card, value $50) on this Global Webinar Day. In order to join the draw, simply answer the hidden treasure question that will be part of the questionnaire at the end of the Webinar. Good Luck!

Register today watch a recording

b2ap3_thumbnail_Fotolia_33050826_XS_20150804-182656_1.jpg

A recording of this Webinar will be available to all who register!
(Take a look at our previous Webinars here.)

Thanks to Infosim for the article.

Campus to Cloud Network Visibility

Visibility. Network visibility. Simple terms that are thrown around quite a bit today. But the reality isn’t quite so simple. Why?

Scale for one. It’s simple to maintain visibility for a small network. But large corporate or enterprise networks? That’s another story altogether. Visibility solutions for these large networks have to scale from one end of the network to the other end – from the campus and branch office edge to the data center and/or private cloud. Managing and troubleshooting performance issues demands that we maintain visibility from the user to application and every step or hop in between.

So deploying a visibility architecture or design from campus to cloud requires scale. When I say scale, I mean scale on multiple layers – 5 layers to be exact – product, portfolio, design, management, and support. Let’s look at each one briefly.

Product Scale

Building an end-to-end visibility architecture for an enterprise network requires products that can scale to the total aggregate traffic from across the entire network, and filter that traffic for distribution to the appropriate monitoring and visibility tools. This specifically refers to network packet brokers that can aggregate traffic from 1GE, 10GE, 40GE, and even 100GE links. But it is more than just I/O. These network packet brokers have to have capacity that scales – meaning they have to operate at wire rate – and provide a completely non-blocking architecture whether they exist in a fixed port configuration or a modular- or chassis-based configuration.

Portfolio Scale

Building an end-to-end visibility architecture for an enterprise network also requires a portfolio that can scale. This means a full portfolio selection of network taps, virtual taps, inline bypass switches, out-of-band network packet brokers, inline network packet brokers, and management. Without these necessary components, your designs are limited and your future flexibility is limited.

Design Scale

Building an end-to-end visibility architecture for an enterprise network also requires a set of reference designs or frameworks that can scale. IT organizations expect their partners to provide solutions and not simply product – partners that can provide architectures or design frameworks that solve the most pressing challenges that IT is grappling with on a regular basis.

Management Scale

Building an end-to-end visibility architecture for an enterprise network requires management scale. Management scale is pretty much self-explanatory – a management solution that can manage the entire portfolio of products used in the overall design framework. However, it goes beyond that. Management requires integration. Look for designs that can also integrate easily into existing data center management infrastructures. Look for designs that allow automated service or application provisioning. Automation can really help to provide management scalability.

Support Scale

Building and supporting an end-to-end visibility architecture for an enterprise network requires support services that scale, both in skills sets and geography. Skill sets implies that deployment services and technical support personnel understand more than simply product, but that they understand the environments in which these visibility architectures operate as well. And obviously support services must be 24 x 7 and cover deployments globally.

So, if you’re looking to build an end-to-end visibility solution for your enterprise network, consider the scalability of the solution you’re considering. Consider scale in every sense of the word, not simply product scale. Deploying campus to cloud visibility requires scale from product, to portfolio, to design, to management, to support.

Additional Resources:

Ixia network visibility solutions

Ixia network packet brokers

Thanks to Ixia for the article

Top 10 Key Metrics for NetFlow Monitoring

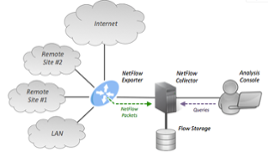
NetFlow is a feature that was introduced on Cisco routers that provides the ability to collect IP network traffic as it enters or exits an interface. By analyzing the data provided by NetFlow, a network administrator can determine things such as the source and destination of traffic, class of service, and the causes of congestion.

There are numerous key metrics when it comes to Netflow Monitoring:

1-Netflow Top Talkers

The flows that are generating the heaviest system traffic are known as the “top talkers.” The NetFlow Top Talkers feature allows flows to be sorted so that they can be viewed, to identify key users of the network.

2-Application Mapping

Application Mapping lets you configure the applications identified by NetFlow. You can add new applications, modify existing ones, or delete them. It’s also usually possible to associate an IP address with an application to help better track applications that are tied to specific servers.

3-Alert profiles

Alert profiles makes network monitoring using NetFlow easier. It allows for the Netflow system to be watching the traffic and alarming on threshold breaches or other traffic behaviors.

4-IP Grouping

You can create IP groups based on IP addresses and/or a combination of port and protocol. IP grouping is useful in tracking departmental bandwidth utilization, calculating bandwidth costs and ensuring appropriate usage of network bandwidth.

5-Netflow Based Security features

NetFlow provides IP flow information in the network. In the field of network security, IP flow information provided by NetFlow is used to analyze anomaly traffic. NetFlow based anomaly traffic analysis is an appropriate supplement to current signature-based NIDS.

6- Top Interfaces

Included in the Netflow Export information is the interface that the traffic passes through. This can be very useful when trying to diagnose network congestion, especially on lower bandwidth WAN interfaces as well as helping to plan capacity upgrades / downgrades for the future.

7- QoS traffic Monitoring

Most networks today enable some level of traffic prioritization. Multimedia traffic like VoIP and Video which are more susceptible to problems when there are network delays typically are tagged as higher priority than other traffic like web and email. Netflow can track which traffic is tagged with these priority levels. This enables network engineers to make sure that the traffic is being tagged appropriately.

8- AS Analysis

Most Netflow tools are able to also show the AS (Autonomous System) number and well known AS assignments for the IP traffic. This can be very useful in peer analysis as well as watching flows across the “border” of a network. For ISP’s and other large organizations this information can be helpful when performing traffic and network engineering analysis especially when the network is being redesigned or expanded.

9- Protocol analysis

One of the most basic metrics that Netflow can provide is a breakdown of TCP/IP protocols in use on the network like TCP, UDP, ICMP etc. This information is typically combined with port and IP address information to provide a complete view of the applications on the network.

10- Extensions with IPFIX

Although technically not NetFlow, IPFIX is fast becoming the preferred method of “flow-based” analysis. This is mainly due to the flexible structure of IPFIX which allows for variable length fields and proprietary vendor information. This is critical when trying to understand deeper level traffic metrics like HTTP host, URLs, messages and more.

Thanks to NMSaaS for the article. 

How To Monitor VoIP Performance In The Real World

It’s one of the most dreaded calls to get for an IT staff member – the one where a user complains about the quality of their VoIP call or video conference. The terms used to describe the problem are reminiscent of a person who brings their car in for service because of a strange sound “ I hear a crackle”, or “it sounds like the other person is in a tunnel” or “I could only hear every other word – and then the call dropped”. None of these are good, and unfortunately, they are all very hard to diagnose.

As an IT professional, we are used to solving problems. We are comfortable in a binary world, something works or it doesn’t and when it doesn’t, we fix the issue so that it does. When a server or application is unavailable, we can usually diagnose and fix the issue and then it works again. But, with VoIP and Video, the situation is not so cut and dried. It’s rare that the phone doesn’t work at all – it usually “works” i.e the phone can make and receive calls, but often the problems are more nuanced; the user is unhappy with the “experience” of the connection. It’s the difference between having a bad meal and the restaurant being closed.

In the world of VoIP, this situation has even been mathematically described (leave it to engineers to come up with a formula). It is called a Mean Opinion Score (MOS) and is used to provide a data point which represents how a user “feels” about the quality of a call. The rating system looks like this:

How To Monitor VoIP Performance In The Real World

Today, the MOS score is accepted as the main standard by which the quality of VoIP calls are measured. There are conditional factors that go into what makes an “OK” MOS score which take into account (among other things) the CODEC which is used in the call. As a rule of thumb, any MOS score below ~3.7 is considered a problem worth investigating, and anything consistently below 2.0 is real issue. *(many organizations use a different # other than 3.7, but it is usually pretty close to this). The main factors which go into generating this score come from 3 KPI’s

  1. Loss
  2. Jitter
  3. Latency / Delay

So, in order to try and bring some rigor to monitoring VoIP quality on a network (and get to the issues before the users get to you) network staff need to monitor the MOS score for VoIP calls. In the real world there are at least three (separate) ways of doing this:

1) The “ACTUAL” MOS score from live calls based on reports from the VoIP endpoints

Some VoIP phones will actually perform measurements of the critical KPI’s (Loss, Jitter, and Latency) and send reports of the call quality to a Call Manager or other server. Most commonly this information is transmitted using the Real Time Control Protocol (RTCP) and may also include RTCP XR (for eXtended Report) data which can provide additional information like Signal to Noise Ratio and Echo level. Support for RTCP / RTCP XR is highly dependent on the phone system being used and in particular the handset being used. If your VoIP system does support RTCP / RTCP XR you will still need a method of capturing and reporting / alarming on the data provided.

2) The “PREDICTED” MOS score based on network quality metrics from a synthetic test call.

Instead of waiting for the phones to tell you there is a problem, many network managers implement a testing system which makes periodic synthetic calls on the network and then gathers the KPI’s from those calls. Generally, this type of testing takes place completely outside of the VoIP phone system and uses vendor software to replicate an endpoint. The software is installed at critical ends of a test path and then the endpoints “call” each other (by sending an RTP stream from one endpoint to another). These systems should be able to exactly mimic the live VoIP system in terms of CODEC used and QoS tagging etc so that the test frames are passed through the network in exactly the same way that a “real” VoIP call would be. These systems can then “predict” the Quality of experience that the network is providing at that moment.

3) The “ACTUAL” MOS score bases on a passive analysis of the live packets on the network.

This is where a passive “probe” product is put into the network and “sniffs” the VoIP calls. It can then inspect that traffic and create a MOS score or other metrics which is useful to determine the current quality of service being experienced by users. This method removes any need for support from the VoIP system and also does not require the network to handle additional test data, but does have some drawbacks as this method can be expensive and may have trouble accurately reading any encrypted VoIP traffic.

Which is best? Well, they both all have their place, and in a perfect world an IT staff would have access to live data and test data in order to troubleshoot an issue. In an even more perfect world, they would be able to correlate that data in real time to other potentially performance impacting information like router / switch performance data and network bandwidth usage (especially on WAN circuits).

In the end, VoIP performance monitoring comes down to having access to all of the critical KPI’s that could be used to diagnose issues and (hopefully) stop users from making that dreaded service call.

How To Monitor VoIP Performance In The Real World

Thanks to NMSaaS for the article.

Can Your Analyzer Handle a VoIP Upgrade?

Your looking at doing an upgrade to your VoIP system, as it approaching end of life.   But your network has changed substantially since your first deployment, making this an ideal time to investigate new VoIP systems and ensure your existing monitoring solution can keep pace with the upgrade.

Here are 4 critical areas for consideration to determine whether your monitoring tools can keep pace with the new demands of a VoIP upgrade.

1. SUPPORTING MORE THAN ONE IT TEAM:

If you have a voice team and a network team, you might live and breathe packet-level details while the voice is accustomed to metrics like jitter, R-Factor, and MOS.

CAN YOUR NETWORK MONITORING SOLUTION PROVIDE VOIP-SPECIFIC QUALITY ASSESSMENTS PLUS PACKET AND TRANSACTION DETAILS FOR PROBLEM RESOLUTION?

Can Your Analyzer Handle a VoIP Upgrade?

2. ADDRESSING CONFIGURATION CHALLENGES:

In rolling out large VoIP deployment systems, device and system misconfigurations can get the best of even the most experienced network team.  To bring VoIP to the desktop ensure you have a proper Network Change and Configiration Management System (NCCM), and run a through  pre-deployment  evalution and you have the monitoring capabilities to ensure for successful implementation.

3. ISOLATING THE ROOT CAUSE:

If users are or departments are experiencing bad MOS scores. How quickly can you navigate to the source of the problem? Your analyzer should be able to determine whether the call manager or a bad handset might be at the root of your VoIP frustrations?  The analyzer should be able to isolate the source of quality problems.

4. SUPPORTING MULTI-VENDOR INSTALLATIONS:

Does you network analyzer provide detailed tracking for multiple VoIP vendors? Your monitoring solution needs to understand how each VoIP system/vendor handles calls. Otherwise you will have to toggle between multiple screens to troubleshoot. Without this support, you may be forced to toggle between multiple screens to troubleshoot or reconcile various quality metrics to assess VoIP performance.

CONCLUSION

Understanding the changes in the environment, ensuring rapid problem isolation, tackling potential configuration challenges, and assessing your solution’s support for multiple vendors are the keys to ensuring a successful rollout.

Improving Network Visibility – Part 4: Intelligent, Integrated, and Intuitive Management

In the three previous blogs in this series, I answered an often asked customer question – “What can really be done to improve network visibility?” – with discussions on data and packet conditioning, advanced filtering, and automated data center capability. In the fourth part of this blog series, I’ll reveal another set of features that can further improve network visibility and deliver even more verifiable benefits.

Too quickly summarize, this multi-part blog covers an in-depth view of various features that deliver true network visibility benefits. There are five fundamental feature sets that will be covered:

  • Data & Packet Conditioning
  • Advanced Packet Filtering
  • Automated Real Time Response Capability
  • Intelligent, Integrated, and Intuitive Management
  • Vertically-focused Solution Sets

When combined, these capabilities can “supercharge” your network. This is because the five categories of monitoring functionality work together to create a coherent group of features that can, and will, lift the veil of complexity. These feature sets need to be integrated, yet modular, so you can deploy them to attack the complexity. This will allow you to deliver the right data to your monitoring and security tools and ultimately solve your business problems.

This fourth blog focuses on intelligent, integrated, and intuitive management of your network monitoring switches – also known as network packet brokers (NPB). Management of your equipment is a key concern. If you spend too much time on managing equipment, you lose productivity. If you don’t have the capability to properly manage all the equipment facets, then you probably won’t derive the full value from your equipment.

When it comes to network packet brokers, the management of these devices should align to your specific needs. If you purchase the right NPBs, the management for these devices will be intelligent, integrated, and intuitive.

So, what do we mean by intelligent, integrated, and intuitive? The following are the definitions I use to describe these terms and how they can control/minimize complexity within an element management system (EMS):

Intuitive – This is involves a visual display of information. Particularly, an easy to read GUI that shows you your system, ports, and tool connections at a glance so you don’t waste time or miss things located on a myriad of other views.

Integrated – Everyone wants the option of “One Stop Shopping.” For NPBs, this means no separate executables required for basic configuration. Best-of-breed approaches often sound good, but the reality of integrating lots of disparate equipment can become a nightmare. You’ll want a monitoring switch that has already been integrated by the manufacturer with lots of different technologies. This gives you the flexibility you want without the headaches.

Intelligent – A system that is intelligent can handle most of the nitpicky details, which are usually the ones that take the most effort and reduce productivity the most. Some examples include: the need for a powerful filtering engine behind the scenes to prevent overlap filtering and eliminate the need to create filtering tables, auto-discovery, ability to respond to commands from external systems, and the ability to initiate actions based upon user defined threshold limits.

At the same time, scalability is the top technology concern of IT for network management products, according to the EMA report Network Management 2012: Megatrends in Technology, Organization and Process published in February 2012. A key component of being able to scale is the management capability. Your equipment management capability will throttle how well your system scales or doesn’t.

The management solution for a monitoring switch should be flexible but powerful enough to allow for growth as your business grows – it should be consistently part of the solution and not the problem and must, therefore, support current and potential future needs. The element management system needs to allow for your system growth either natively or through configuration change. There are some basic tiered levels of functionality that are needed. I’ve attempted to summarize these below but more details are available in a whitepaper.

Basic management needs (these features are needed for almost all deployments)

  • Centralized console – Single pane of glass interface so you can see your network at a glance
  • The ability to quickly and easily create new filters
  • An intuitive interface to easily visualize existing filters and their attributes
  • Remote access capability
  • Secure access mechanisms

Small deployments – Point solutions of individual network elements (NEs) (1 to 3) within a system

  • Simple but powerful GUI with a drag and drop interface
  • The ability to create and apply individual filters
  • Full FCAPS (fault, configuration, accounting, performance, security) capability from a single interface

Clustered solutions – Larger solutions for campuses or distributed environments with 4 to 6 NEs within a system

  • These systems need an EMS that can look at multiple monitoring switches from a single GUI
  • More points to control also requires minimal management and transmission overhead to reduce clutter on the network
  • Ability to create filter templates and libraries
  • Ability to apply filter templates to multiple NE’s

Large systems – Require an EMS for large scale NE control

  • Need an ability for bulk management of NE’s
  • Require a web-based (API) interface to existing NMS
  • Need the ability to apply a single template to multiple NE’s
  • Need role-based permissions (that offer the ability to set and forget filter attributes, lock down ports and configuration settings, “internal” multi-tenancy, security for “sensitive” applications like CALEA, and user directory integration – RADIUS, TACACS+, LDAP, Active Directory)
  • Usually need integration capabilities for reporting and trend analysis

Integrated solutions – Very large systems will require integration to an external NMS either directly or through EMS

  • Need Web-based interface (API) for integration to existing NMS and orchestration systems
  • Need standardized protocols that allow external access to monitoring switch information (SYSLOG, SNMP)
  • Require role-based permissions (as mentioned above)
  • Requires support for automation capabilities to allow integration to data center and central office automation initiatives
  • Must support integration capabilities for business Intelligence collection, trend analysis, and reporting

Statistics should be available within the NPB, as well as through the element management system, to provide business intelligence information. This information can be used for instantaneous information or captured for trend analysis. Most enterprises typically perform some trending analysis of the data network. This analysis would eventually lead to a filter deployment plan and then also a filter library that could be exported as a filter-only configuration file loadable through an EMS on other NPBs for routine diagnostic assessments.

More information on the Ixia Net Tool Optimizer (NTO) monitoring switch and advanced packet filtering is available on the Ixia website. In addition, we have the following resources available:

  • Building Scalability into Visibility Management
  • Best Practices for Building Scalable Visibility Architectures
  • Simplify Network Monitoring whitepaper

Additional Resources:

Ixia Net Tool Optimizer (NTO)

White Paper: Building Scalability into Visibility Management

Ixia Visibility Solutions

Thanks to Ixia for the article. 

“Who Makes the Rules?” The Hidden Risks of Defining Visibility Policies

Imagine what would happen if the governor of one state got to change all the laws for the whole country for a day, without the other states or territories ever knowing about it. And then the next day, another governor gets to do the same. And then another.

Such foreseeable chaos is precisely what happens when multiple IT or security administrators define traffic filtering policies without some overarching intelligence keeping tabs on who’s doing what. Each user acts from their own unique perspective with the best of intentions –but with no way to know how the changes they make might impact other efforts.

In most large enterprises, multiple users need to be able to view and alter policies to maximize performance and security as the network evolves. In such scenarios, however, “last in, first out” policy definition creates dangerous blind spots, and the risk may be magnified in virtualized or hybrid environments where visibility architectures aren’t fully integrated.

Dynamic Filtering Accommodates Multiple Rule-makers, Reduces Risk of Visibility Gap

Among the advances added to latest release of Ixia’s Net Tool Optimizer™ (NTO) network packet brokers are enhancements to the solution’s unique Dynamic Filtering capabilities. This patented technique imposes that overarching intelligence over the visibility infrastructure as multiple users act to improve efficiency or divert threats. This technology becomes an absolute requirement when automation is used in the data center as dynamic changes to network filters require advanced calculations to other filters to ensure overlaps are updated to prevent loss of data.

Traditional rule-based systems may give a false sense of security and leave an organization vulnerable as security tools don’t see everything they need to see in order to do their job effectively. Say you have 3 tools each requiring slightly different but overlapping data.

  • Tool 1 wants a copy of all packets on VLAN 1-3
  • Tool 2 wants a copy of all packets containing TCP
  • Tool 3 wants a copy of all packets on VLAN 3-6

Overlap occurs in that both Tools 1 and 3 need to see TCP on VLAN 3. In rule-based systems, once a packet matches a rule, it is forwarded on and no longer available. Tool 1 will receive TCP packets on VLAN 3 but not tool 3. This creates a false sense of security because tool 3 still receives data and is not generating an alarm, which would indicate all is well. But what if the data stream going to tool 1 contains the smoking gun? Tool 3 would have detected this. And as we know from recent front-page breaches, a single incident can ruin a company’s brand image and have a severe financial impact.

Extending Peace of Mind across Virtual Networks

NVOS 4.3 also integrates physical and virtual visibility, allowing traffic from Ixia’s Phantom™ Virtualization Taps (vTaps) or standard VMware-based visibility solutions to be terminated on NTO along with physical traffic. Together, these enhancements eliminate serious blind spots inherent in other solutions avoiding potential risk and, worst case, liability caused by putting data at risk.

Integrating physical and virtual visibility minimizes equipment costs and streamlines control by eliminating extra devices that add complexity to your network. Other new additions –like the “double your ports” feature extend the NTO advantage delivering greater density, flexibility and ROI.

Download the latest NTO NVOS release from www.ixiacom.com.

Additional Resources:

Ixia Visibility Solutions

Thanks to Ixia for the article

Infosim® Global Webinar Day June 25th, 2015 – Convince Your Boss that You Need a New iPhone: Introducing the New StableNet® Mobile App

Join Dr. David Hock, Senior Consultant R&D, and Eduardo González, Developer & Consultant, for a Webinar on “The new StableNet® Mobile App”.

This Webinar will provide insight into:

  • How will the StableNet® Mobile App make your life easier?
  • How are Apple™ Swift and the StableNet® REST API maximizing the user experience?
  • What functionality does the StableNet® Mobile App bring to your fingertips? [Live Demo]
  • When can you get the Mobile App for your StableNet® infrastructure?

A recording of this Webinar will be available to all who register!

b2ap3_thumbnail_Fotolia_33050826_XS.jpg

(Take a look at our previous Webinars here.)