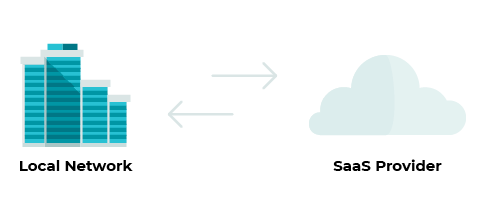
With the popularity of SaaS platforms on the rise, network performance metrics become an invaluable tool in the hands of network administrators, who cannot afford to waste time resolving issues that originate outside their network.
Office 365, G Suite, Salesforce and many other SaaS platforms are replacing applications operated in-house by IT departments. While easy to use and broadly available, they also suffer from outages and performance degradation’s. This could be frustrating to IT departments, which are still held responsible for applications while losing visibility and control. How to regain control and make sure your SaaS applications are working properly? Network performance metrics are the way to go.
When the SaaS delivery model became a standard option for mid-sized or large companies, it soon turned out that legacy infrastructure and application monitoring methods are not designed for online applications. In practice, they simply fail to provide satisfactory answers to the following questions:
- Is it a network issue?
- Is it a degradation of performance on the application side?
- Is there a problem with my internet connectivity?
To answer those questions we need to move forward in our infrastructure monitoring capabilities and introduce network performance or user experience monitoring tools. The first step is to measure network performance metrics, like round trip time (network delay), server response time (application delay) or re-transmissions (network degradation). NPM metrics are the key figures to look at when a user complains about performance degradation. The next step is to identify the specific traffic related to the SaaS application in question. This may sound like sci-fi, since all the traffic is encrypted, but in fact, thanks to Encrypted Traffic Analysis capability and metadata extracted from the network traffic itself, individual applications can easily be recognized and the corresponding performance metrics visualized on the application dashboard.

Once we have monitoring in place, we can also introduce reporting and alerting for performance degradation. You can define absolute threshold values for individual metrics (average or maximum value) as well as relative thresholds compared to NPM baselines continuously updated depending on real network traffic. For instance, when using Office 365 the concern is to distinguish from network and application delay as well as to recognize re-transmissions in the internet up-link. The dashboard then summarizes the status of individual alerts while notifications can vary between email, Syslog or SNMP trap depending on user preference.

Let’s now take a look at one example – server response time. This metric represents a part of the delay observed by the client and caused by the application itself. An average value of one hour is used for performance degradation alerting, with the threshold defined as a 100% increase in the current value compared to prediction (baseline). A similar approach can be used for other metrics as well.

What, then, is the typical use of all these metrics? Let’s imagine a situation where a user complains about SaaS application performance. Not only do administrators already know about it, they have excluded the network as the root cause of this issue and reported the performance degradation to technical support, who can quickly handle the issue and fix it without delay. The status can then be reported to the user.
With the popularity of SaaS platforms on the rise, network performance metrics become an invaluable tool in the hands of network administrators, who cannot afford to waste time resolving issues that originate outside their network. These metrics in combination with encrypted traffic analysis give them clear insight into where degradation’s come from and save hours in troubleshooting.
Thank you to Pavel Minarik from Flowmon, for the article.