Benefits of Network Security Forensics

The networks that your business operates on are often open and complex.

Your IT department is responsible for mitigating network risks, managing performance and auditing data to ensure functionality.

Using NetFlow forensics can help your IT team maintain the competitiveness and reliability of the systems required to run your business.

In IT, network security forensics involves the monitoring and analysis of your network’s traffic to gather information, obtain legal evidence and detect network intrusions.

These activities help keep your company perform the following actions.

  • Adjust to increased data and NetFlow volumes
  • Identify heightened security vulnerabilities and threats
  • Align with corporate and legislative compliance requirements
  • Contain network costs
  • Analyze network performance demands
  • Recommend budget-friendly implementations and system upgrades

NetFlow forensics helps your company maintain accountability and trace usage; these functions become increasingly difficult as your network becomes more intricate.

The more systems your network relies on, the more difficult this process becomes.

While your company likely has standard security measures in place, e.g. firewalls, intrusion detection systems and sniffers, they lack the capability to record all network activity.

Tracking all your network activity in real-time at granular levels is critical to the success of your organization.

Until recently, the ability to perform this type of network forensics has been limited due to a lack of scalability.

Now, there are web-based solutions that can collect and store this data to assist your IT department with this daunting task.

Solution capabilities include:

  • Record NetFlow data at a micro level
  • Discover security breaches and alert system administrators in real-time
  • Identify trends and establish performance baselines
  • React to irregular traffic movements and applications
  • Better provisioning of network services

The ability to capture all of this activity will empower your IT department to provide more thorough analysis and take faster action to resolve system issues.

But, before your company can realize the full value of NetFlow forensics, your team needs to have a clear understanding of how to use this intelligence to take full advantage of these detailed investigative activities.

Gathering the data through automation is a relatively simple process once the required automation tools have been implemented.

Understanding how to organize these massive amounts of data into clear, concise and actionable findings is an additional skill set that must be developed within your IT team.

Having a team member, whether internal or via a third-party vendor, that can aggregate your findings and create visual representations that can be understood by non-technical team members is a necessary part of NetFlow forensics. It is important to stress the necessity of visualization; this technique makes it much easier to articulate the importance of findings.

In order to accurately and succinctly visualize security issues, your IT staff must have a deep understanding of the standard protocols of your network. Without this level of understanding, the ability to analyze and investigate security issues is limited, if not impossible.

Utilizing a software to support the audit functions required to perform NetFlow forensics will help your company support the IT staff in the gathering and tracking of these standard protocols.

Being able to identify, track and monitor the protocols in an automated manner will enhance your staff’s ability to understand and assess the impact of these protocols on network performance and security. It will also allow you to quickly assess the impact of changes driven by real-time monitoring of your network processes.

Sound like a daunting task?

It doesn’t have to be. Choose a partner to support your efforts and help you build the right NetFlow forensics configuration to support your business.

Contact us today and let us help you manage your company’s IT network.

Benefits of Network Security ForensicsThanks to NetFlow Auditor for the article.

5 Reasons Why You Must Back Up Your Routers and Switches

I’ve been working in the Network Management business for over 20 years, and in that time I have certainly seen my share of networks. Big and small, centralized and distributed, brand name vendor devices in shiny datacenters, and no-name brands in basements and bunkers. The one consistent surprise I continue to encounter is how many of these organization (even the shiny datacenter ones) lack a backup system for their network device configurations.

I find that a little amazing, since I also can’t tell you the last time I talked to a company that didn’t have a backup system for their servers and storage systems. I mean, who doesn’t backup their critical data? It seems so obvious that hard drive need to be backed up in case of problems –and yet many of these same organizations, many of whom spend huge amounts of money on server backup, do not even think of backing up the critical configurations of the devices that actually move the traffic around.

So, with that in mind, I present 5 reasons why you must back up your Routers and Switches (and Firewalls and WLAN controllers, and Load Balancers etc).

1. Upgrades and new rollouts.

Network Devices get swapped out all of the time. In many cases, these rollouts are planned and scheduled. At some point (if you’re lucky) an engineer will think about backing up the configuration of the old device before the replacements occurs. However, I have seen more than one time when this didn’t happen. In those cases, the old device is gone, and the new devices need to be reconfigured from scratch – hopefully with all of the correct configs. A scheduled backup solution makes these situations a lot less painful.

2. Disaster Recovery.

This is the opposite of the simple upgrade scenario. The truth is that many times a device is not replaced until it fails. Especially those “forgotten” devices that are on the edge of networks in ceilings and basements and far flung places. These systems rarely get much “love” until there is a problem. Then, suddenly, there is an outage – and in the scramble to get back up and running, and central repository of the device configuration can be a time (and life) saver.

3. Compliance

We certainly see this more in larger organizations, but it also becomes a real driving force in smaller companies that operate in highly regulated industries like banking and healthcare. If your company falls into one of those categories, then chances are you actually have a duty to backup your devices in order to stay within regulatory compliance. The downside of being non-compliant can be harsh. We have worked with companies that were being financially penalized for every day they were out of compliance with a number of policies including failure to have a simple router / switch / firewall backup system in place.

4. Quick Restores.

Ask most network engineers and they will tell you – we’ve all had that “oops” moment when we were making an configuration change on the fly and realized just a second after hitting “enter” that we just broke something. Hopefully, we just took down a single device. Sometimes it’s worse than that and we go into real panic mode. I can tell you, it is that exact moment when we realize how important configuration backups can be. The restoration process can be simple and (relatively) painless, or it can be really, really painful; and it all comes down to whether or not you have good backups.

5. Policy Checking.

One of the often overlooked benefits of backing up your device configurations, is that it allows an NCCM systems to then automatically scan those backups and compare them to known good configurations in order to ensure compliance to company standards. Normally, this is a very tedious (and therefore ignored) process – especially in large organizations with many devices and many changes taking place. Sophisticated systems can quickly identify when a device configuration has changed, immediately backup the new config, and then scan that config to make sure it’s not violating any company rules. Regular scans can be rolled up into scheduled reports which provide management with a simple but important audit of all devices that are out of compliance.

Bottom Line:

Routers, Switches and Firewalls really are the heart of a network. Unless they are running smoothly, everything suffers. One of the simplest yet effective practices for helping ensure the operation of a network is to implement an automatic device configuration backup system.

Top 20 Best Practices for NCCM

Thanks to NMSaaS for the article. 

NetFlow Auditor – Best Practices for Network Traffic Analysis Webinar

In this Webinar John Olson, from NetFlow Auditor, discusses the top 10 Best Practices for using Netflow data to analyse, report and alert on multiple aspects of Network traffic.

These best practices include:

  • Understanding where is the best place in your network to collect netflow data from
  • How long you should retain your flow data
  • Why you should archive more than just the top 100 flows
  • When static thresholds should be replaced by adaptive thresholds
  • More…

b2ap3_thumbnail_Fotolia_33050826_XS_20151006-142344_1.jpg

Thanks to NetFlow Auditor for the article.  

CIO Review – Infosim Unified Solution for Automated Network Management

CIO Review

20 Most Promising Networking Solution Providers

Virtualization has become the life blood of the networking industry today. With the advent of technologies such as software-defined networking and network function virtualization, the black box paradigm or the legacy networking model has been shattered. In the past, the industry witnessed networking technology such as Fiber Distributed Data Interface (FDDI), which eventually gave way to Ethernet, the predominant network of choice. This provided opportunities to refresh infrastructures and create new networking paradigms.Today, we see a myriad of proprietary technologies, competing for the next generation networking models that are no longer static, opaque or rigid.

Ushering a new way of thinking and unlocking the possibilities, customers are increasingly demanding for automation from the network solution providers. The key requirement is an agile network controlled from a single source. Visibility into the network has also become a must-have in the networking spectrum, providing realtime information about the events befalling inside the networks.

In order to enhance enterprise agility, improve network efficiency and maintain high standards of security, several innovative players in the industry are delivering cutting-edge solutions that ensure visibility, cost savings and automation in the networks. In the last few months we have looked at hundreds of solution providers who primarily serve the networking industry, and shortlisted the ones that are at the forefront of tackling challenges faced by this industry.

In our selection, we looked at the vendor’s capability to fulfill the burning needs of the sector through the supply of a variety of cost effective and flexible solutions that add value to the networking industry. We present to you CIO Review’s 20 Most Promising Networking Solution Providers 2015.

Infosim Unified Solution for Automated Network Management

Today’s Networking technology though very advanced, faces a major roadblock—the lack of automation in the network management products. “These products are incapable of delivering a truly unified management approach as they are not an integrated solution but merely a collection of different programs bound together under one GUI to give them the appearance of an integrated solution,” notes Jim Duster, CEO, Infosim. Moreover, the need for continuously updating new device information, changes in configurations, and alerts and actions across these different toolsets are contributing to an ongoing financial burden for enterprises. Addressing these concerns with a unique network management solution is Infosim, a manufacturer of Automated Service Fulfillment and Service Assurance solutions.

Infosim offers StableNet, a unified solution developed and designed to cover performance management, fault management, and configuration management with a software that is engineered with a single code base and a consistent data model underneath. “StableNet is the only “suite” within the network performance management software industry,” claims Duster. The solution addresses the existing operational and technical challenges of managing distributed, virtualized, and mission critical IT infrastructures. “With this approach, we are able to create work flows in every unique customer business and industry to cover many processes efficiently,” he adds. For instance, StableNet monitors the production equipment of a manufacturing company. In case of an equipment failure, the error is being reported and StableNet delivers the root cause of the problem, while notifying an external service provider. The service provider’s technician can open an inspection window with StableNet, exchange the defective device and after re air, can provide feedback to the customer’s operations center.

For supporting the flexible deployment of StableNet, the company offers Infosim StableNet appliance, a high performance, preconfigured, security-hardened, hardware platform. “Appliances related to StableNet series reduce Total Cost of Ownership (TCO) by simplifying deployment, consolidating network infrastructure, and providing an extensible platform that can scale with your organization,” states Duster. StableNet also provides a low cost agent platform called the StableNet Embedded Agent (SNEA)—that enables highly distributed installations to support End-to-End (E2E) Visibility, Cloud Monitoring and Internet of Things. The deployment of SNEA is economical and is auto discovered at tactical collection points in networks, thus resulting into a low TCO for collecting and processing network performance actions and alerts.

Infosim StableNet is deployed across the networks of major players in the Telco and Enterprise markets including that of a German auto manufacturer. Acting as the client’s centralized system, StableNet reduced their toolset from over 10 disparate software and hardware offerings from multiple suppliers to less than four. This significantly reduced TCO while increasing service levels. “Siloed IT personnel who used to hide behind non-consolidated results from their individual solutions were all synchronized into one solution, speeding productivity, collaboration and communication,” states Duster.

Infosim is currently participating in advanced research projects on Software-Defined Networking (SDN) and Network Functions Virtualization (NFV) with several universities and leading industry device manufacturers. “The company applies 50 percent of its new software development resource to customer needs which assists customers in achieving milestones in vendor agnostic device support additions, industry specific capabilities, and features that were envisioned by real users,” asserts Duster.

For the years ahead, Infosim plans to build upon its product capability by automating the processes and activities that produce guaranteed service levels and reduce the consumption of human resources in the Network Operations Center (NOC). “Our vision is to enable the Dark NOC, which means a large percent of the non-value adding activities of network engineers can be automated in our product, freeing network engineers to work on proactive new innovations and concepts,” Duster concludes.

Thanks to Infosim for the article. 

3 Reasons for Real Time Configuration Change Detection

So far, we have explored what NCCM is, and taken a deep dive into device policy checking – in this post we are going to be exploring Real Time Configuration Change Detection (or just Change Detection as I will call it in this blog). Change Detection is the process by which your NCCM system is notified – either directly by the device or from a 3rd party system that a configuration change has been made on that device. Why is this important? Let’s identify 3 main reasons that Change Detection is a critical component of a well deployed NCCM solution.

1. Unauthorized change recording. As anyone that works in an enterprise IT department knows, changes need to be made in order to keep systems updated for new services, users and so on. Most of the time, changes are (and should be) scheduled in advance, so that everyone knows what is happening, why the change is being made, when it is scheduled and what the impact will be on running services.

However, the fact remains that anyone with the correct passwords and privilege level can usually log into a device and make a change at any time. Engineers that know the network and feel comfortable working on the devices will often just login and make “on-the-fly” adjustments that they think won’t hurt anything. Unfortunately as we all know, those “best intentions” can lead to disaster.

That is where Change Detection can really help. Once a change has been made, it will be recorded by the device and a log can be transmitted either directly to the NCCM system or to a 3rd party logging server which then forwards the message to the NCCM system. At the most basic level this means that if something does go wrong, there is an audit trail which can be investigated to determine what happened and when. It can also potentially be used to roll back the changes to a known good state

2. Automated actions.

Once a change has been made (scheduled or unauthorized) many IT departments will wish to perform some automated actions immediately at the time of change without waiting for a daily or weekly schedule to kick in. Some of the common automated activities are:

  • Immediate configuration backup. So that all new changes are recorded in the backup system.
  • Launch of a new discovery. If the change involved any hardware or OS type changes like a version upgrade, then the NCCM system should also re-discover the device so that the asset system has up-to-date information about the device

These automation actions can ensure that the NCCM and other network management applications are kept up to date as changes are being made without having to wait for the next scheduled job to start. This ensures that any other systems are not acting “blindly” when they try to perform an action with/on the changed device.

3. Policy Checking. New configuration changes should also prompt an immediate policy check of the system to ensure that the change did not inadvertently breach a compliance or security rule. If a policy has been broken, then a manager can be notified immediately. Optionally, if the NCCM system is capable of remediation, then a rollback or similar operation can happen to bring the system back into compliance immediately.

Almost all network devices are capably of logging hardware / software / configuration changes. Most of the time these can easily be exported in the form of an SNMP trap or Syslog. A good NCCM system can receive these messages, parse them to understand what has happened and if the log signifies a change has taken place – is then able to take some action(s) as described above. This real time configuration change detection mechanism is a staple part of an enterprise NCCM solution and should be implemented in all organizations where network changes are commonplace.

Top 20 Best Practices for NCCM

Thanks to NMSaaS for the article.

The Importance of State

Ixia recently added passive SSL decryption to the ATI Processor (ATIP). ATIP is an optional module in several of our Net Tool Optimizer (NTO) packet brokers that delivers application-level insight into your network with details such as application ID, user location, and handset and browser type. ATIP gives you this information via an intuitive real-time dashboard, filtered application forwarding, and rich NetFlow/IPFIX.

Adding SSL decryption to ATIP was a logical enhancement, given the increasing use of SSL for both enterprise applications and malware transfer – both things that you need to see in order to monitor and understand what’s going on. For security, especially, it made a lot of sense for us to decrypt traffic so that a security tool can focus on what it does best (such as malware detection).

When we were starting our work on this feature, we looked around at existing solutions in the market to understand how we could deliver something better. After working with both customers and our security partners, we realized we could offer added value by making our decrypted output easier to use.

Many of our security partners can either deploy their systems inline (traffic must pass through the security device, which can selectively drop packets) or out-of-band (the security device monitors a copy of the traffic and sends alerts on suspicious traffic). Their flexible ability to deploy in either topology means they’re built to handle fully stateful TCP connections, with full TCP handshake, sequence numbers, and checksums. In fact, many will flag an error if they see something that looks wrong. It turns out that many passive SSL solutions out there produce output that isn’t fully stateful and can flag errors or require disabling of certain checks.

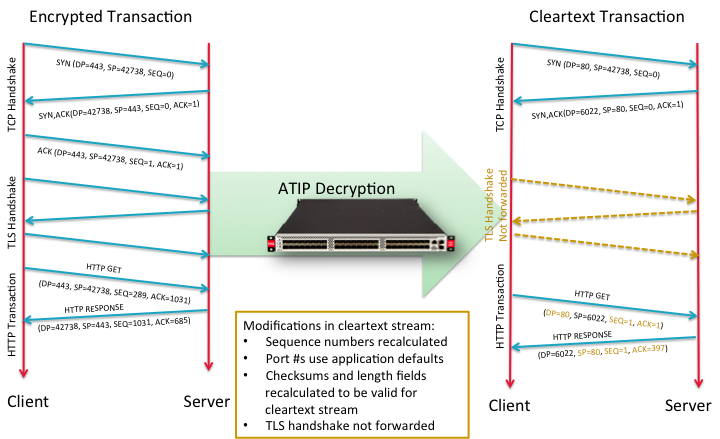
What exactly does this mean? Well, a secure web connection starts with a 3-way TCP handshake (see this Wikipedia article for more details), typically on port 443, and both sides choose a random starting sequence (SEQ) number. This is followed by an additional TLS handshake that kicks off encryption for the application, exchanging encryption parameters. After the encryption is nailed up, the actual application starts and the client and server exchange application data.

When decrypting and forwarding the connection, some of the information from the original encrypted connection either doesn’t make sense or must be modified. Some information, of course, must be retained. For example, if the security device is expecting a full TCP connection, then it expects a full TCP handshake at the beginning of the connection – otherwise packets are just appearing out of nowhere, which is typically seen as a bad thing by security devices.

Next, in the original encrypted connection, there’s a TLS handshake that won’t make any sense at all if you’re reading a cleartext connection (note that ATIP does forward metadata about the original encryption, such as key length and cipher, in its NetFlow/IPFIX reporting). So when you forward the cleartext stream, the TLS handshake should be omitted. However, if you simply drop the TLS handshake packets from the stream, then the SEQ numbers (which keep count of transmitted packets from each side) must be adjusted to compensate for their omission. And every TCP packet includes a checksum that must also be recalculated around the new decrypted packet contents.

If you open up the decrypted output from ATIP, you can see all of this adjustment has taken place. Here’s a PCAP of an encrypted Netflix connection that has been decrypted by ATIP:

The Importance of State

You’ll see there are no out-of-sequence packets, and no indication of any dropped packets (from the TLS handshake) or invalid checksums. Also note that even though the encrypted connection was on port 443, this flow analysis shows a connection on port 80. Why? Because many analysis tools will expect encrypted traffic on port 443 and cleartext traffic on port 80. To make interoperability with these tools easier, ATIP lets you remap the cleartext output to the port of your choice (and a different output port for every encrypted input port). You might also note that Wireshark shows SEQ=0. That’s not the actual sequence number; Wireshark just displays a 0 for the first packet of any connection so you can use the displayed SEQ number to count packets.

The following ladder diagram might also help to make this clear:

The Importance of State

To make Ixia’s SSL decryption even more useful, we’ve also added a few other new features. In the 1.2.1 release, we added support for Diffie Helman keys (previously, we only supported RSA keys), as well as Elliptic Curve ciphers. We’ve also added reporting of key encryption metadata in our NetFlow/IPFIX reporting:

The Importance of State

As you can see, we’ve been busy working on our SSL solution, making sure we make it as useful, fast, and easy-to-use as possible. And there’s more great stuff on the way. So if you want to see new features, or want more information about our current products or features, just let us know and we’ll get on it.

More Information

ATI Processor Web Portal

Wikipedia Article: Transmission Control Protocol (TCP)

Wikipedia Article: Transport Layer Security (TLS)

Thanks to Ixia for the article.

Virtualization Visibility

See Virtual with the Clarity of Physical

The cost-saving shift to virtualization has challenged network teams to maintain accurate views. While application performance is often the first casualty when visibility is reduced, the right solution can match and in some cases even exceed the capabilities of traditional monitoring strategies.

Virtual Eyes

Network teams are the de facto “first responders” when application performance degrades. For this reason, it’s critical to maintain visibility into and around all virtual constructs for effective troubleshooting and optimal service delivery. Otherwise, much of the value of server virtualization and consolidation efforts may be offset by sub-par application performance.

Fundamentally, achieving comprehensive visibility of a virtualized server environment requires an understanding of the health of the underlying resources, including host, hypervisor, and virtual switch (vSwitch) along with perimeter client, and application traffic.

In addition, unique communication technologies like VXLAN, and Cisco FabricPath must be supported for full visibility into the traffic in these environments. Without this support, network analyzers cannot gain comprehensive views into virtual data center (VDC) traffic.

Step One: Get Status of Host and Virtualization Components

The host, hypervisor, and vSwitch are the foundation of the entire virtualization effort so their health is crucial. Polling technologies such as SNMP, WSD, and WMI can provide performance insight by interrogating the host and various virtualized elements. A fully-integrated performance management platform can not only provide these views, but also display relevant operating metrics in a single, user-friendly dashboard.

Metrics like CPU utilization, memory usage, and virtualized variables like individual VM instance status are examples of accessible data. Often, these parameters can point to the root cause of service issues that may otherwise manifest themselves indirectly.

Virtualization Visibility

For example, poor response time of an application hosted on a virtualized server may have nothing to do with the service or the network, but may instead be tied to excessively high CPU utilization. Without this monitoring perspective, troubleshooting will be more difficult and time consuming.

Next Steps

Virtualization and consolidation offers significant upside for today’s dynamic data center model and in achieving optimal IT business service delivery. However, monitoring visibility must be maintained so potential application degradation issues can be detected and resolved before impacting the end user.

To learn more about how your team can achieve the same visibility in virtualized environments as you do in physical environments, download the complete 3 Steps to Server Virtualization Visibility White Paper now.

Thanks to Viavi Solutions for the article.

Don’t Miss the Forest for the Trees: Taps vs. SPAN

These days, your network is as important to your business as any other item—including your products. Whether your customers are internal or external, you need a dependable and secure network that grows with your business. Without one, you are dead in the water.

IT managers have a nearly impossible job. They must understand, manage, and secure the network all the time against all problems. Anything less than a 100 percent working network is a failure. There is a very familiar saying: Don’t miss the forest for the trees. Meaning don’t let the details prevent you from seeing the big picture. But what if the details ARE the big picture?

Today’s IT managers can’t miss the forest OR the trees!

Network visibility is a prime tool in properly monitoring your network. You need an end-to-end visibility architecture to truly see your network. This visibility architecture must reveal both the big picture and the smallest details to present a true view of what is happening in the network.

The first building-block to your visibility architecture is access to the data. To efficiently monitor a network, you must have complete visibility into that network. This means being able to reliably capture 100% of the network traffic under all network conditions.

To achieve this, devices need to be installed into the network to capture that data using “taps” or Switch Port Analyzers (SPANs).

A tap is a passive splitting mechanism placed between two network devices. It provides a monitoring connection. Using taps, you can easily connect monitoring devices such as protocol analyzers, RMON probes and intrusion detection and prevention systems to the network. The tap duplicates all traffic on the link and forwards this to the monitoring device. Any monitoring device connected to a tap receives the same traffic as if it were in-line. This includes all errors. Taps do not introduce delay, or alter the content or structure of the data. They also fail open so that traffic continues to flow between network devices, even if you remove a monitoring device or power to the device is lost.

A SPAN port – also known as a mirroring port – is a function of one or more ports on a switch in the network. Like a tap, monitoring devices can also be attached to this SPAN port.

So what are the advantages of taps vs SPAN?

  • A tap captures everything on the wire, including MAC and media errors. A SPAN port will drop those packets.
  • A tap is unaffected by bandwidth saturation. A SPAN port cannot handle heavily used full-duplex links without dropping packets.
  • A tap is simple to install. A SPAN port requires an engineer to configure the switch or switches.
  • A tap is not an addressable network device. It cannot be hacked. SPAN ports leave you vulnerable.
  • A tap doesn’t require you to dedicate a switch port to monitoring. It frees the monitoring port up for switching traffic.

Don’t Miss the Forest for the Trees: Taps vs. SPAN

Thanks to Ixia for the article.

A Deeper Look Into Network Device Policy Checking

In our last blog post “Why you need NCCM as part of your Network Management Platform” I introduced the many reasons that growing networks should investigate and implement an NCCM solution. One of the reasons is that an NCCM system can help with automation in a key area which is related to network security as well as compliance and availability – Policy Checking.

So, in this post, I will be taking a deeper dive into Network Device Policy Checking which will (hopefully) shed some light onto what I believe is an underutilized component of NCCM.

The main goal of Policy Checking in general is to make sure that all network devices are adhering to pre-determined standards with regard to their configuration. These standards are typically put in place to address different but interrelated concerns. Broadly speaking these concerns are broken down into the following:

  1. Device Authentication, Authorization and Accounting (AAA, ACL)
  2. Specialized Regulatory Compliance Rules (PCI, FCAPS, SOX, HIPAA …)
  3. Device Traffic Rules (QoS policies etc.)

Device Authentication, Authorization and Accounting (AAA)

AAA policies focus on access to devices – primarily by engineering staff- for the purposes of configuration, updating and so forth as well as how this access is authenticated, and tracked. Access to infrastructure devices are policed and controlled with the use of AAA TACACS+, RADIUS servers, and ACLs (Access Control Lists) so as to increase security access into device operating systems.

It is highly recommended to create security policies so that the configurations of security access can be policed for consistency and reported on if changed or vital elements of the configuration are missing.

Many organizations, including the very security conscious NSA, even publish guidelines for AAA policies they believe should be implemented.

They offer these guidelines for specific vendors such as Cisco and others which can be downloaded from their website http://www.nsa.gov these guidelines are useful to anyone that is interested in securing their network infrastructure, but become hard requirements if you need to interact in anyway with US government or military networks.

Some basic rules include:

  1. Establishing a dedicated management network
  2. Encrypt all traffic between the manager and the device
  3. Establishing multiple levels or roles for administrators
  4. Logging the devices activities

These rules, as well as many others, offer a first step toward maintain a secure infrastructure.

Specialized Regulatory Compliance Rules:

Many of these rules are similar to and overlap with the AAA rules mentioned above. However, these policies often have very specialized additional components designed for special restrictions due to regulatory laws, or certification requirements.

Some of the most common policies are designed to meet the requirements of devices that carry traffic with sensitive data like credit card numbers, or personal data like Social Security numbers or hospital patient records.

For example, according to PCI, public WAN link connections are considered untrusted public networks. A VPN is required to securely tunnel traffic between a store and the enterprise network. The Health Insurance Portability and Accountability Act (HIPAA) also provides guidelines around network segmentation (commonly implemented with VLAN’s) where traffic carrying sensitive patient data should be separated from “normal” traffic like Web and email.

If your company or organization has to adhere to these regulatory requirements, then it is imperative that such configuration policies are put in place and checked on a consistent basis to ensure compliance.

Device Traffic Rules:

These rule policies are generally concerned with the design of traffic flow and QoS policies. In large organizations and service providers (Telco’s, MSP’s, ISP’s) it is common to differentiate traffic based on pre-defined service types related to prioritization or other distinction.

Ensuring service design rules are being applied and policed is usually a manual process and therefore is susceptible to inaccuracies. Creating design policy rules provides greater control around the service offerings, i.e. QOS settings for Enhanced service offerings, or a complete End-2-End service type, and ensures compliancy with the service delivery SLAs (Service Level Agreements).

Summary:

Each of these rules and potentially others should be defined and policed on a continuous basis. Trying to accomplish this manually is very time consuming, inefficient, and fraught with potential errors (which can become really big problems).

The best way to keep up with these policy requirements is with an automated, electronic policy checking engine. These systems should be able to run on a schedule and detect whether the devices under its control are in or out of compliance. When a system is found to be out of compliance, then it should certainly have the ability to report this to a manager, and potentially even have the ability to auto-remediate the situation. Remediation may involve removing any known bad configurations or rolling back the configuration to a previously known “good” state.

b2ap3_thumbnail_a59aa1b3-b1de-4b3c-a75f-5f279e9cfe6c-1_20150914-142624_1.png

Thanks to NMSaaS for the article.

Infosim® Global Webinar – Why is this App So Terribly Slow?

Infosim® Global Webinar Day
Why is this app so terribly slow?

How to achieve full
Application Monitoring with StableNet®

Infosim® Global Webinar Day September 24th, 2015 Why is this App So Terribly Slow?Join Matthias Schmid, Director of Project Management with Infosim® for a Webinar and Live Demo on “How to achieve full Application Monitoring with StableNet®”.

This Webinar will provide insight into:

  • Why you need holistic monitoring for all your company applications
  • How the technologies offered by StableNet® will help you master this challenge

Furthermore, we will provide you with an exclusive insight into how StableNet® was used to achieve full application monitoring for a global company.

Infosim® Global Webinar Day September 24th, 2015 Why is this App So Terribly Slow?b2ap3_thumbnail_Fotolia_33050826_XS_20150928-173035_1.jpg

A recording of this Webinar will be available to all who register!
(Take a look at our previous Webinars here.)

Thanks to Infosim for the article.