NMSaaS Webinar – Stop paying for Network Inventory Software & let NMSaaS do it for FREE.

Please join NMSaaS CTO John Olson for a demonstration of our free Network Discovery, Asset & Inventory Solution.

Wed, Jul 29, 2015 1:00 PM – 1:30 PM CDT

Do any of these problems sound familiar?

  • My network is complex and I don’t really even know exactly what we have and where it all is.
  • I can’t track down interconnected problems
  • I don’t know when something new comes on the network
  • I don’t know when I need upgrades
  • I suspect we are paying too much for maintenance

NMSaaS is here to help.

Sign up for the webinar NOW > > >

In this webinar you will learn that you can receive the following:

  • Highly detailed complimentary Network Discovery, Inventory and Topology Service
  • Quarterly Reports with visibility in 100+ data points including:
    • Device Connectivity Information
    • Installed Software
    • VM’s
    • Services / Processes
    • TCP/IP Ports in use
    • More…
  • Deliverables – PDF Report & Excel Inventory List

Thanks to NMSaaS for the article.

3 Steps to Configure Your Network For Optimal Discovery

All good network monitoring / management begins the same way – with an accurate inventory of the devices you wish to monitor. These systems must be on boarded into the monitoring platform so that it can do its job of collecting KPI’s, backing up configurations and so on. This onboarding process is almost always initiated through a discovery process.

This discovery is carried out by the monitoring system and is targeted at the devices on the network. The method of targeting may vary, from a simple list of IP addresses or host names, to a full subnet discovery sweep, or even by using an exported csv file from another system. However, the primary means of discovery is usually the same for all Network devices, SNMP.

Additional means of onboarding can (and certainly do) exist, but I have yet to see any full-featured management system that does not use SNMP as one of its primary foundations.

SNMP has been around for a long time, and is well understood and (mostly) well implemented in all major networking vendors’ products. Unfortunately, I can tell you from years of experience that many networks are not optimally configured to make use of SNMP and other important configuration options which when setup correctly will optimize the network for a more efficient and ultimately more successful discovery and onboarding process.

Having said that, below are 3 simple steps that should be taken, in order to help maximize your network for optimal discovery.

1) Enable SNMP

Yes it seems obvious to say that if SNMP isn’t enabled then it will not work. But, as mentioned before it still astonishes me how many organizations I work with that still do not have SNMP enabled on all of the devices they should have. These days almost any device that can connect to a network usually has some SNMP support built in. Most networks have SNMP enabled on the “core” devices like Routers / Switches / Servers, but many IT pros many not realize that SNMP is available on non- core systems as well.

Devices like VoIP phones and video conferencing systems, IP connected security cameras, Point of Sale terminals and even mobile devices (via apps) can support SNMP. By enabling SNMP on as many possible systems in the network, the ability to extend the reach of discovery and monitoring has grown incredibly and now gives visibility into the network end-points like never before.

2) Setup SNMP correctly

Just enabling SNMP isn’t enough – the next step is to make sure it is configured correctly. That means removing / changing the default Read Only (RO) community string (which is commonly set by default to “public”) to a more secure string. It is also best practice to use as few community strings as you can. In many large organizations, there can be some “turf wars” over who gets to set these strings on systems. The Server team may have one standard string and the network team has another.

Even though most systems will allow for multiple strings, it is generally best to try to keep these as consistent as possible. This helps prevent confusion when setting up new systems and also helps eliminate unnecessary discovery overhead on the management systems (which may have to try multiple community strings for each device on an initial discovery run). As always, security is important, so you should configure the IP address of the known management server as an allowed SNMP system and block any other systems from being allowed to run an SNMP query against your systems.

3) Enable Layer 2 discovery protocols

In your network, you want much deeper insight into not only what you have, but how it is all connected. One of the best way to get this information is to enable layer 2 (link layer) discovery abilities. Depending on the vendor(s) you have in your network, this may accomplished with a proprietary protocol like the Cisco Discovery Protocol (CDP) or it may be implemented in a generic standard like the Link Layer Discovery Protocol (LLDP). In either case, by enabling these protocols, you gain valuable L2 connectivity information like connected MAC addresses, VLAN’s, and more.

By following a few simple steps, you can dramatically improve the results of your management system’s onboarding / discovery process and therefore gain deeper and more actionable information about your network.

b2ap3_thumbnail_6313af46-139c-423c-b3d5-01bfcaaf724b.png

Thanks to NMSaaS for the article.

Infosim® Global Webinar Day July 30th, 2015 – The Treasure Hunt is On!

How to visualize the state of your network and service infrastructure to uncover the hidden treasures in your data

Infosim® Global Webinar Day July 30th, 2015 - The treasure hunt is on! Join Harald Höhn, Sea Captain and Senior Developer on a perilous treasure hunt on “How to visualize the state of your network and service infrastructure to uncover the hidden treasure in your data”.

This Webinar will provide insight into:

  • How to speed up your workflows with auto-generated Weather Maps
  • How to outline complex business processes with Weather Maps
  • How to uncover the hidden treasures in your data [Live Demo]

Infosim® Global Webinar Day July 30th, 2015 - The treasure hunt is on! But wait, there is more! We are giving away three treasure maps (Amazon Gift Card, value $50) on this Global Webinar Day. In order to join the draw, simply answer the hidden treasure question that will be part of the questionnaire at the end of the Webinar. Good Luck!

Register today watch a recording

b2ap3_thumbnail_Fotolia_33050826_XS_20150804-182656_1.jpg

A recording of this Webinar will be available to all who register!
(Take a look at our previous Webinars here.)

Thanks to Infosim for the article.

Top 10 Key Metrics for NetFlow Monitoring

NetFlow is a feature that was introduced on Cisco routers that provides the ability to collect IP network traffic as it enters or exits an interface. By analyzing the data provided by NetFlow, a network administrator can determine things such as the source and destination of traffic, class of service, and the causes of congestion.

There are numerous key metrics when it comes to Netflow Monitoring:

1-Netflow Top Talkers

The flows that are generating the heaviest system traffic are known as the “top talkers.” The NetFlow Top Talkers feature allows flows to be sorted so that they can be viewed, to identify key users of the network.

2-Application Mapping

Application Mapping lets you configure the applications identified by NetFlow. You can add new applications, modify existing ones, or delete them. It’s also usually possible to associate an IP address with an application to help better track applications that are tied to specific servers.

3-Alert profiles

Alert profiles makes network monitoring using NetFlow easier. It allows for the Netflow system to be watching the traffic and alarming on threshold breaches or other traffic behaviors.

4-IP Grouping

You can create IP groups based on IP addresses and/or a combination of port and protocol. IP grouping is useful in tracking departmental bandwidth utilization, calculating bandwidth costs and ensuring appropriate usage of network bandwidth.

5-Netflow Based Security features

NetFlow provides IP flow information in the network. In the field of network security, IP flow information provided by NetFlow is used to analyze anomaly traffic. NetFlow based anomaly traffic analysis is an appropriate supplement to current signature-based NIDS.

6- Top Interfaces

Included in the Netflow Export information is the interface that the traffic passes through. This can be very useful when trying to diagnose network congestion, especially on lower bandwidth WAN interfaces as well as helping to plan capacity upgrades / downgrades for the future.

7- QoS traffic Monitoring

Most networks today enable some level of traffic prioritization. Multimedia traffic like VoIP and Video which are more susceptible to problems when there are network delays typically are tagged as higher priority than other traffic like web and email. Netflow can track which traffic is tagged with these priority levels. This enables network engineers to make sure that the traffic is being tagged appropriately.

8- AS Analysis

Most Netflow tools are able to also show the AS (Autonomous System) number and well known AS assignments for the IP traffic. This can be very useful in peer analysis as well as watching flows across the “border” of a network. For ISP’s and other large organizations this information can be helpful when performing traffic and network engineering analysis especially when the network is being redesigned or expanded.

9- Protocol analysis

One of the most basic metrics that Netflow can provide is a breakdown of TCP/IP protocols in use on the network like TCP, UDP, ICMP etc. This information is typically combined with port and IP address information to provide a complete view of the applications on the network.

10- Extensions with IPFIX

Although technically not NetFlow, IPFIX is fast becoming the preferred method of “flow-based” analysis. This is mainly due to the flexible structure of IPFIX which allows for variable length fields and proprietary vendor information. This is critical when trying to understand deeper level traffic metrics like HTTP host, URLs, messages and more.

Thanks to NMSaaS for the article. 

NTO Now Provides Twice the Network Visibility

Ixia is proud to announce that we are expanding one of the key capabilities in Ixia xStream platforms, “Double Your Ports,” to our Net Tool Optimizers (NTO) family of products. As of our 4.3 release, this capability to double the number of network and monitor inputs is now available on the NTO platform. If you are not familiar with Double Your Ports, it is a feature that allows you to add additional network or tool ports to your existing NTO by allowing different devices to share a single port. For example, if you have used all of the ports on your NTO but want to add a new tap, you can enable Double Your Ports so that a Net Optics Tap and a monitoring tool can share the same port, utilizing both the RX and TX sides of the port. This is how it works:

Standard Mode

In the standard mode, the ports will behave in a normal manner: when there is a link connection on the RX, the TX will operate. When the RX is not connected, the system assumes the TX link is also not connected (down).

Loopback Mode

When you designate a port to be loopback, the data egressing on the TX side will forward directly to the RX side of the same port. This functionality does not require a loopback cable to be plugged into the port. The packets will not transmit outside of the device even if a cable is connected.

Simplex Mode

When you designate a port to be in simplex mode, the port’s TX state is not dependent on the RX state. In the standard mode, when the RX side of the port goes down, the TX side is disabled. If you assign a port mode to simplex, the TX state is up when there is a link on the TX even when there is no link on the RX. You could use a simplex cable to connect a TX of port A to an RX of port B. If port A is in simplex mode, the TX will transmit even when the port A RX is not connected.

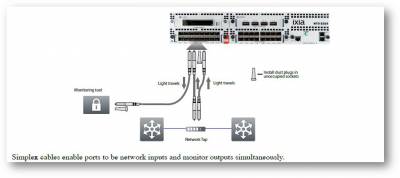
To “double your ports” you switch the port into simplex mode, then use simplex fiber cables and connect the TX fiber to a security or monitoring tool and the RX fiber to a tap or switch SPAN port. On NTO, the AFM ports such as the AFM 16 support simplex mode allowing you to have 32 connections per module: 16 network inputs and 16 monitor outputs simultaneously (with advanced functions on up to 16 of those connections). The Ixia xStream’s 24 ports can be used as 48 connections: 24 network inputs and 24 monitor outputs simultaneously.

The illustration below shows the RX and TX links of two AFM ports on the NTO running in simplex mode. The first port’s RX is receiving traffic from the Network Tap and the TX is transmitting to a monitoring tool.

The other port (right hand side on NTO) is interconnected to the Network Tap with its RX using a simplex cable whereas its TX is unused (dust-cap installed).

With any non-Ixia solution, this would have taken up three physical ports on the packet broker. With Ixia’s NTO and xStream packet brokers we are able to double up the traffic and save a port for this simple configuration, with room to add another monitoring tool where the dust plug is shown. If you expand this across many ports you can double your ports in the same space!

NTO Now Provides Twice the Network Visibility

Click here to learn more about Ixia’s Net Tool Optimizer family of products.

Additional Resources:

Ixia xStream

Ixia NTO solution

Ixia AFM

Solution Focus Category

Network Visibility

Thanks to Ixia for the article.

Improving Network Visibility – Part 4: Intelligent, Integrated, and Intuitive Management

In the three previous blogs in this series, I answered an often asked customer question – “What can really be done to improve network visibility?” – with discussions on data and packet conditioning, advanced filtering, and automated data center capability. In the fourth part of this blog series, I’ll reveal another set of features that can further improve network visibility and deliver even more verifiable benefits.

Too quickly summarize, this multi-part blog covers an in-depth view of various features that deliver true network visibility benefits. There are five fundamental feature sets that will be covered:

  • Data & Packet Conditioning
  • Advanced Packet Filtering
  • Automated Real Time Response Capability
  • Intelligent, Integrated, and Intuitive Management
  • Vertically-focused Solution Sets

When combined, these capabilities can “supercharge” your network. This is because the five categories of monitoring functionality work together to create a coherent group of features that can, and will, lift the veil of complexity. These feature sets need to be integrated, yet modular, so you can deploy them to attack the complexity. This will allow you to deliver the right data to your monitoring and security tools and ultimately solve your business problems.

This fourth blog focuses on intelligent, integrated, and intuitive management of your network monitoring switches – also known as network packet brokers (NPB). Management of your equipment is a key concern. If you spend too much time on managing equipment, you lose productivity. If you don’t have the capability to properly manage all the equipment facets, then you probably won’t derive the full value from your equipment.

When it comes to network packet brokers, the management of these devices should align to your specific needs. If you purchase the right NPBs, the management for these devices will be intelligent, integrated, and intuitive.

So, what do we mean by intelligent, integrated, and intuitive? The following are the definitions I use to describe these terms and how they can control/minimize complexity within an element management system (EMS):

Intuitive – This is involves a visual display of information. Particularly, an easy to read GUI that shows you your system, ports, and tool connections at a glance so you don’t waste time or miss things located on a myriad of other views.

Integrated – Everyone wants the option of “One Stop Shopping.” For NPBs, this means no separate executables required for basic configuration. Best-of-breed approaches often sound good, but the reality of integrating lots of disparate equipment can become a nightmare. You’ll want a monitoring switch that has already been integrated by the manufacturer with lots of different technologies. This gives you the flexibility you want without the headaches.

Intelligent – A system that is intelligent can handle most of the nitpicky details, which are usually the ones that take the most effort and reduce productivity the most. Some examples include: the need for a powerful filtering engine behind the scenes to prevent overlap filtering and eliminate the need to create filtering tables, auto-discovery, ability to respond to commands from external systems, and the ability to initiate actions based upon user defined threshold limits.

At the same time, scalability is the top technology concern of IT for network management products, according to the EMA report Network Management 2012: Megatrends in Technology, Organization and Process published in February 2012. A key component of being able to scale is the management capability. Your equipment management capability will throttle how well your system scales or doesn’t.

The management solution for a monitoring switch should be flexible but powerful enough to allow for growth as your business grows – it should be consistently part of the solution and not the problem and must, therefore, support current and potential future needs. The element management system needs to allow for your system growth either natively or through configuration change. There are some basic tiered levels of functionality that are needed. I’ve attempted to summarize these below but more details are available in a whitepaper.

Basic management needs (these features are needed for almost all deployments)

  • Centralized console – Single pane of glass interface so you can see your network at a glance
  • The ability to quickly and easily create new filters
  • An intuitive interface to easily visualize existing filters and their attributes
  • Remote access capability
  • Secure access mechanisms

Small deployments – Point solutions of individual network elements (NEs) (1 to 3) within a system

  • Simple but powerful GUI with a drag and drop interface
  • The ability to create and apply individual filters
  • Full FCAPS (fault, configuration, accounting, performance, security) capability from a single interface

Clustered solutions – Larger solutions for campuses or distributed environments with 4 to 6 NEs within a system

  • These systems need an EMS that can look at multiple monitoring switches from a single GUI
  • More points to control also requires minimal management and transmission overhead to reduce clutter on the network
  • Ability to create filter templates and libraries
  • Ability to apply filter templates to multiple NE’s

Large systems – Require an EMS for large scale NE control

  • Need an ability for bulk management of NE’s
  • Require a web-based (API) interface to existing NMS
  • Need the ability to apply a single template to multiple NE’s
  • Need role-based permissions (that offer the ability to set and forget filter attributes, lock down ports and configuration settings, “internal” multi-tenancy, security for “sensitive” applications like CALEA, and user directory integration – RADIUS, TACACS+, LDAP, Active Directory)
  • Usually need integration capabilities for reporting and trend analysis

Integrated solutions – Very large systems will require integration to an external NMS either directly or through EMS

  • Need Web-based interface (API) for integration to existing NMS and orchestration systems
  • Need standardized protocols that allow external access to monitoring switch information (SYSLOG, SNMP)
  • Require role-based permissions (as mentioned above)
  • Requires support for automation capabilities to allow integration to data center and central office automation initiatives
  • Must support integration capabilities for business Intelligence collection, trend analysis, and reporting

Statistics should be available within the NPB, as well as through the element management system, to provide business intelligence information. This information can be used for instantaneous information or captured for trend analysis. Most enterprises typically perform some trending analysis of the data network. This analysis would eventually lead to a filter deployment plan and then also a filter library that could be exported as a filter-only configuration file loadable through an EMS on other NPBs for routine diagnostic assessments.

More information on the Ixia Net Tool Optimizer (NTO) monitoring switch and advanced packet filtering is available on the Ixia website. In addition, we have the following resources available:

  • Building Scalability into Visibility Management
  • Best Practices for Building Scalable Visibility Architectures
  • Simplify Network Monitoring whitepaper

Additional Resources:

Ixia Net Tool Optimizer (NTO)

White Paper: Building Scalability into Visibility Management

Ixia Visibility Solutions

Thanks to Ixia for the article. 

“Who Makes the Rules?” The Hidden Risks of Defining Visibility Policies

Imagine what would happen if the governor of one state got to change all the laws for the whole country for a day, without the other states or territories ever knowing about it. And then the next day, another governor gets to do the same. And then another.

Such foreseeable chaos is precisely what happens when multiple IT or security administrators define traffic filtering policies without some overarching intelligence keeping tabs on who’s doing what. Each user acts from their own unique perspective with the best of intentions –but with no way to know how the changes they make might impact other efforts.

In most large enterprises, multiple users need to be able to view and alter policies to maximize performance and security as the network evolves. In such scenarios, however, “last in, first out” policy definition creates dangerous blind spots, and the risk may be magnified in virtualized or hybrid environments where visibility architectures aren’t fully integrated.

Dynamic Filtering Accommodates Multiple Rule-makers, Reduces Risk of Visibility Gap

Among the advances added to latest release of Ixia’s Net Tool Optimizer™ (NTO) network packet brokers are enhancements to the solution’s unique Dynamic Filtering capabilities. This patented technique imposes that overarching intelligence over the visibility infrastructure as multiple users act to improve efficiency or divert threats. This technology becomes an absolute requirement when automation is used in the data center as dynamic changes to network filters require advanced calculations to other filters to ensure overlaps are updated to prevent loss of data.

Traditional rule-based systems may give a false sense of security and leave an organization vulnerable as security tools don’t see everything they need to see in order to do their job effectively. Say you have 3 tools each requiring slightly different but overlapping data.

  • Tool 1 wants a copy of all packets on VLAN 1-3
  • Tool 2 wants a copy of all packets containing TCP
  • Tool 3 wants a copy of all packets on VLAN 3-6

Overlap occurs in that both Tools 1 and 3 need to see TCP on VLAN 3. In rule-based systems, once a packet matches a rule, it is forwarded on and no longer available. Tool 1 will receive TCP packets on VLAN 3 but not tool 3. This creates a false sense of security because tool 3 still receives data and is not generating an alarm, which would indicate all is well. But what if the data stream going to tool 1 contains the smoking gun? Tool 3 would have detected this. And as we know from recent front-page breaches, a single incident can ruin a company’s brand image and have a severe financial impact.

Extending Peace of Mind across Virtual Networks

NVOS 4.3 also integrates physical and virtual visibility, allowing traffic from Ixia’s Phantom™ Virtualization Taps (vTaps) or standard VMware-based visibility solutions to be terminated on NTO along with physical traffic. Together, these enhancements eliminate serious blind spots inherent in other solutions avoiding potential risk and, worst case, liability caused by putting data at risk.

Integrating physical and virtual visibility minimizes equipment costs and streamlines control by eliminating extra devices that add complexity to your network. Other new additions –like the “double your ports” feature extend the NTO advantage delivering greater density, flexibility and ROI.

Download the latest NTO NVOS release from www.ixiacom.com.

Additional Resources:

Ixia Visibility Solutions

Thanks to Ixia for the article

Advanced Packet Filtering with Ixia’s Advanced Filtering Modules (AFM)

An important factor in improving network visibility is the ability to pass the correct data to monitoring tools. Otherwise, it becomes very expensive and aggravating for most enterprises to sift through the enormous amounts of data packets being transmitted (now and in the near future). Bandwidth requirements are projected to continue increasing for the foreseeable future – so you may want to prepare now. As your bandwidth needs increase, complexity increases due to more equipment being added to the network, new monitoring applications, and data filtering rule changes due to additional monitoring ports.

Network monitoring switches are used to counteract complexity with data segmentation. There are several features that are necessary to perform the data segmentation needed and refine the flow of data. The most important features needed for this activity are: packet deduplication, load balancing, and packet filtering. Packet filtering, and advanced packet filtering in particular, is the primary workhorse feature for this segmentation.

While many monitoring switch vendors have filtering, very few can perform the advanced filtering that adds real value for businesses. In addition, filtering rules can become very complex and require a lot of staff time to write initially and then to maintain as the network constantly changes. This is time and money wasted on tool maintenance instead of time spent on quickly resolving network problems and adding new capabilities to the network requested by the business.

Basic Filtering

Basic packet filtering consists of filtering the packets as they either enter or leave the monitoring switch. Filtering at the ingress will restrict the flow of data (and information) from that point on. This is most often the worst place to filter as tools and functionality downstream from this point will never have access to that deleted data, and it eliminates the ability to share filtered data to multiple tools. However, ingress filtering is commonly used to limit the amount of data on the network that is passed on to your tool farm, and/or for very security sensitive applications that wish to filter non-trusted information as early as possible.

The following list provides common filter criteria that can be employed:

  • Layer 2
    • MAC address from packet source
    • VLAN
    • Ethernet Type (e.g. IPv4, IPv6, Apple Talk, Novell, etc.)
  • Layer 3
    • DSCP/ECN
    • IP address
    • IP protocol ( ICMP, IGMP, GGP, IP, TCP, etc.)
    • Traffic Class
    • Next Header
  • Layer 4
    • L4 port
    • TCP Control flags

Filters can be set to either pass or deny traffic based upon the filter criteria.

Egress filters are primarily meant for fine tuning of data packets sent to the tool farm. If an administrator tries to use these for the primary filtering functionality, they can easily run into an overload situation where the egress port is overloaded and packets are dropped. In this scenario, aggregated data from multiple network ports may be significantly greater than the egress capacity of the tool port.

Advanced Filtering

Network visibility comes from reducing the clutter and focusing on what’s important when you need it. One of the best ways to reduce this clutter is to add a monitoring switch that can remove duplicated packets and perform advanced filtering to direct data packets to the appropriate monitoring tools and application monitoring products that you have deployed on your network. The fundamental factor to achieve visibility is to get the right data to the right tool to make the right conclusions. Basic filtering isn’t enough to deliver the correct insight into what is happening on the network.

But what do we mean by “advanced filtering”? Advanced filtering includes the ability to filter packets anywhere across the network by using very granular criteria. Most monitoring switches just filter on the ingress and egress data streams.

Besides ingress and egress filtering, operators need to perform packet processing functions as well, like VLAN stripping, VNtag stripping, GTP stripping, MPLS stripping, deduplication and packet trimming.

Ixia’s Advanced Feature Modules

The Ixia Advanced Feature Modules (AFM) help network engineers to improve monitoring tool performance by optimizing the monitored network traffic to include only the essential information needed for analysis. In conjunction with the Ixia Net Tool Optimizer (NTO) product line, the AFM module has sophisticated capability that allows it to perform advanced processing of packet data.

Advanced Packet Processing Features

  • Packet De-Duplication – A normally configured SPAN port can generate multiple copies of the same packet dramatically reducing the effectiveness of monitoring tools. The AFM16 eliminates redundant packets, at full line rate, before they reach your monitoring tools. Doing so will increase overall tool performance and accuracy.
  • Packet Trimming – Some monitoring tools only need to analyze packet headers. In other monitoring applications, meeting regulatory compliance requires tools remove sensitive data from captured network traffic. The AFM16 can remove payload data from the monitored network traffic, which boosts tool performance and keeps sensitive user data secure.
  • Protocol Stripping – Many network monitoring tools have limitations when handling some types of Ethernet protocols. The AFM16 enables monitoring tools to monitor required data by removing GTP, MPLS, VNTag header labels from the packet stream.
  • GTP Stripping – Removes the GTP headers from a GTP packet leaving the tunneled L3 and L4 headers exposed. Enables tools that cannot process GTP header information to analyze the tunneled packets.
  • NTP/GPS Time Stamping – Some latency-sensitive monitoring tools need to know when a packet traverses a particular point in the network. The AFM16 provides time stamping with nanosecond resolution and accuracy.

Additional Resources:

Ixia Advance Features Modules

Ixia Visibility Architecture

Thanks to Ixia for the article. 

Introducing the First Self-Regulating Root Cause Analysis: Dynamic Rule Generation with StableNet® 7

Infosim®, a leading manufacturer of automated Service Fulfillment and Service Assurance solutions for Telcos, ISPs, MSPs and Corporations, today announced a proprietary new technology called Dynamic Rule Generation (DRG) with StableNet® 7.

The challenge: The legacy Fault Management approach includes a built-in dilemma: Scalability vs. Aggregation. On the one hand, it is unfeasible to pre-create all possible rules while on the other hand, not having enough rules will leave NOC personnel with insufficient data to troubleshoot complex scenarios.

The solution: DRG expands and contracts rules that automatically troubleshoot networks by anticipating all possible scenarios from master rule sets. DRG is like cruise control for a network rule set. When DRG is turned on, it can robotically expand and contract rule sets to keep troubleshooting data at optimum levels constantly without human intervention. It will also allow for automatic ticket generation and report alarms raised by dynamically generated rules. DRG leads to fast notification, a swift service Impact Analysis, and results in the first self-regulating Root Cause Analysis in today’s Network Management Software market.

Start automating Fault Management and stop manually creating rules! Take your hands off the keyboard and allow the DRG cruise control to take over!

Supporting Quotes:

Dr. Stefan Köhler, CEO for Infosim® comments:

“We at Infosim® believe you should receive the best value from your network, and exchange of information should be as easy as possible. The way we want to achieve these goals, is to simplify the usage and automate the processes you use to manage your network. Rules creation and deletion has been an Achilles’ heel of legacy network management systems. With DRG (Dynamic Rule Generation), we are again delivering another new technology to our customers to achieve our goal of the dark NOC.”

Marius Heuler, CTO for Infosim® comments:

“By further enhancing the already powerful Root Cause Analysis of StableNet®, we are providing functionality to our users that will both take care of ongoing changes in their networks while automatically keeping the rules up to date.”

ABOUT INFOSIM®

Infosim® is a leading manufacturer of automated Service Fulfillment and Service Assurance solutions for Telcos, ISPs, Managed Service Providers and Corporations. Since 2003, Infosim® has been developing and providing StableNet® to Telco and Enterprise customers. Infosim® is privately held with offices in Germany (Würzburg – Headquarters), USA (Austin) and Singapore.

Infosim® develops and markets StableNet®, the leading unified software solution for Fault, Performance and Configuration Management. StableNet® is available in two versions: Telco (for Telecom Operators and ISPs) and Enterprise (for IT and Managed Service Providers). StableNet® is a single platform unified solution designed to address today’s many operational and technical challenges of managing distributed and mission-critical IT infrastructures.

Many leading organizations and Network Service Providers have selected StableNet® due to its enriched features and reduction in OPEX & CAPEX. Many of our customers are well-known global brands spanning all market sectors. References available on request.

At Infosim®, we take pride in the engineering excellence of our high quality and high performance products. All products are available for a trial period and professional services for proof of concept (POC) can be provided on request.

ABOUT STABLENET®

StableNet® is available in two versions: Telco (for Telecom Operators and ISPs) and Enterprise (for IT and Managed Service Providers).

StableNet® Telco is a comprehensive unified management solution; offerings include: Quad-play, Mobile, High-speed Internet, VoIP (IPT, IPCC), IPTV across Carrier Ethernet, Metro Ethernet, MPLS, L2/L3 VPNs, Multi Customer VRFs, Cloud and FTTx environments. IPv4 and IPv6 are fully supported.

StableNet® Enterprise is an advanced, unified and scalable network management solution for true End-to-End management of medium to large scale mission-critical IT supported networks with enriched dashboards and detailed service-views focused on both Network & Application services.

Thanks to Infosim for the article. 

Security Breaches Keep Network Teams Busy

Network Instruments study shows that network engineers are spending more of their day responding to breaches and deploying security controls.

This should come as no big surprise to most network teams. As security breaches and threats proliferate, they’re spending a lot of time dealing with security issues, according to a study released Monday.

Network Instruments’ eighth annual state of the network report shows that network engineers are increasingly consumed with security chores, including investigating security breaches and implementing security controls. Of the 322 network engineers, IT directors and CIOs surveyed worldwide, 85% said their organization’s network team was involved in security. Twenty percent of those polled said they spend 10 to 20 hours per week on security issues.

Security Breaches Keep Network Teams Busy

Almost 70% said the time they spend on security has increased over the past 12 months; nearly a quarter of respondents said the time spend increased by more than 25%.

The top two security activities keeping networking engineers busy are implementing preventative measures and investigating attacks, according to the report. Flagging anomalies and cleaning up after viruses or worms also are other top time sinks for network teams.

“Network engineers are being pulled into every aspect of security,” Brad Reinboldt, senior product manager for Network Instruments, the performance management unit of JDSU, said in a prepared statement

Security Breaches Keep Network Teams Busy

Network teams are drawn into security investigations and preparedness as high-profile security breaches continue to make headlines. Last year, news of the Target breach was followed by breach reports from a slew of big-name companies, including Neiman Marcus, Home Depot, and Michaels.

A report issued last September by the Ponemon Institute and sponsored by Experian showed that data breaches are becoming more frequent. Of the 567 US executives surveyed, 43 percent said they had experienced a data breach, up from 33% in a similar survey in 2013. Sixty percent said their company had suffered more than one data breach in the past two years, up from 52% in 2013.

According to Network Instruments’ study, syslogs were as the top method for detecting security issues, with 67% of survey respondents reporting using them. Fifty-seven percent use SNMP while 54% said they use anomalies for uncovering security problems.

In terms of security challenges, half of the survey respondents ranked correlating security and network performance as their biggest problem.

The study also found that more than half of those polled expect bandwidth to grow by more than 51% next year, up from the 37% from last year’s study who expected that kind of growth. Several factors are driving the demand, including users with multiple devices, larger data files, and unified communications applications, according to the report.

The survey also queried network teams about their adoption of emerging technologies. It found that year-over-year implementation rates for 40 Gigabit Ethernet, 100GbE, and software-defined networking have almost doubled. One technology that isn’t gaining traction among those polled is 25 GbE, with more than 62% saying they have no plans for it.

Thanks to Network Computing for the article.