Canada is building AI data centres at unprecedented scale. Here’s how to make sure the fabric underneath them actually performs — before the capital is committed.
In May 2026, the Government of Canada and TELUS announced work to advance a sovereign AI factory cluster in British Columbia. This build is designed to scale beyond 60,000 GPUs and 150 megawatts by 2032, drawing on an initial 85 MW of clean power from BC Hydro. Two months earlier, Bell committed $1.7 billion over two years to a 300 MW facility outside Regina, leasing capacity to Cerebras and CoreWeave.
Behind those projects sits the Canadian Sovereign AI Compute Strategy, a $2 billion federal commitment, and the AI Sovereign Compute Infrastructure Program, which allocates roughly $890 million over seven fiscal years beginning in 2026–27.
This is the largest concentrated infrastructure build Canadian networking teams have seen in a generation. And it is happening on a compressed schedule, with hardware that behaves nothing like the enterprise networks most of us have spent our careers operating.
If you are standing up GPU capacity, whether at a service provider, a bank, a research institution, or an enterprise bringing models in-house, this post is about the failure mode that quietly erodes the return on all of it, and the practical sequence for catching it before you have poured concrete.
The gap between what you bought and what you get
Start with a number that should be uncomfortable for anyone who has signed a GPU purchase order.
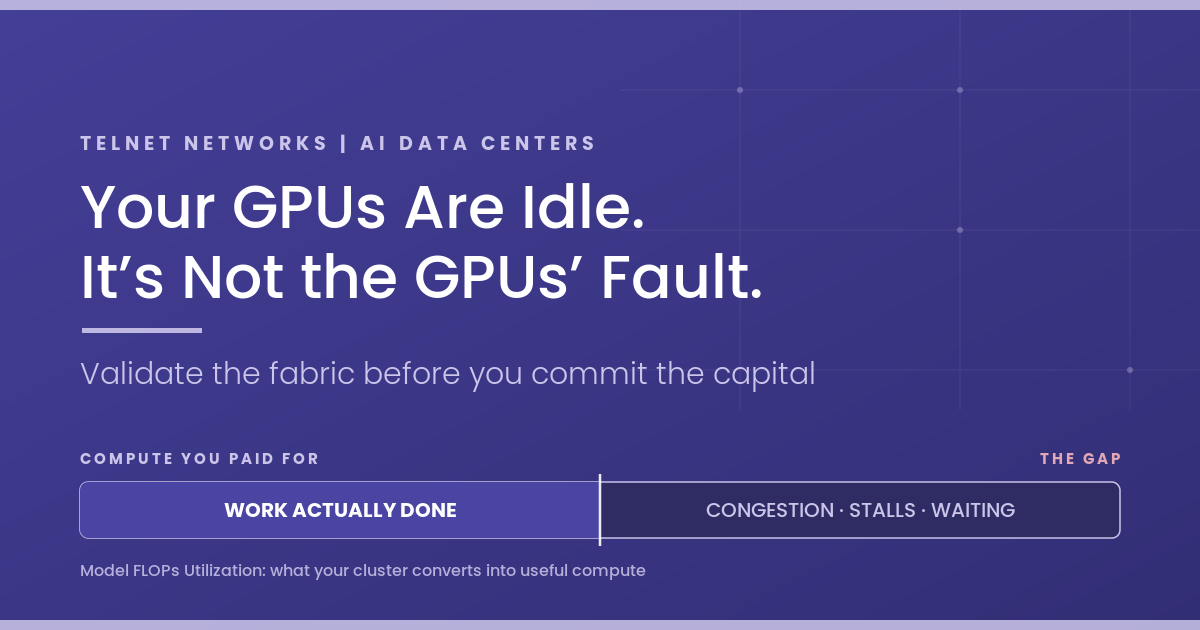
Model FLOPs Utilization (MFU) measures how much of a cluster’s theoretical peak compute a training run actually converts into useful work. It is the honest measure of whether you are getting what you paid for. The published figures from teams with world-class infrastructure engineering are humbling:
| Training run | Reported MFU |
|---|---|
| GPT-3 | 21.3% |
| Megatron-Turing NLG 530B | 30.2% |
| Gopher | 32.5% |
| PaLM 540B | 46.2% (57.8% including rematerialization) |
| Megatron-LM on H100 clusters | up to ~47% |
These are among the most carefully optimized training runs ever executed. They still leave half or more of the theoretical compute on the table.
An important caveat, because it matters for diagnosis: the MFU gap is not all network. Memory-bound operations, pipeline bubbles, kernel inefficiency, and suboptimal parallelism strategy all contribute. Anyone telling you the fabric explains the entire gap is selling something.
But here is what separates the network portion from the rest: it gets worse as you scale, and it is the part you commit to irreversibly when you buy hardware. You can refactor a kernel next quarter. You cannot re-cable a spine layer that was undersized for the traffic pattern you actually run.
Why AI fabrics fail differently
Traditional enterprise networks optimize for north-south traffic and client-server patterns. Loss is tolerable, retransmission is routine, and a few milliseconds of jitter is invisible to the user.
AI training fabrics operate under different physics. Three properties drive almost every problem worth knowing about.
Collective operations create hard synchronization dependencies. When a distributed training job runs an AllReduce, every participating GPU must complete its exchange before the job advances. The job proceeds at the pace of the slowest worker. One congested rack does not slow that rack by 10% — it stalls the entire cluster. Localized congestion produces cluster-wide idle time, which is why the symptom you see (idle accelerators) is so far removed from the cause.
Elephant flows collide at predictable choke points. AI training generates a small number of very large, long-lived flows rather than many small ones. When these converge on the same uplink, you get buffer exhaustion and drops. Meta’s engineering team documented this directly in their production RoCE deployment: fragmented job placement causing congestion on particular switch uplinks degraded training performance by more than 30%. That is a real production number from a team with world-class network engineering, not a vendor projection.
Loss recovery in RDMA is brutally inefficient. When a packet drops in an RDMA transfer, the protocol generally cannot recover it selectively. It waits for a timeout and retransmits the entire operation, or every packet following the loss. A single dropped packet can force retransmission of a very large transfer. Researchers have injected controlled loss rates as low as 0.1% into GPU training setups precisely because the effects compound so sharply at scale.
In an AI fabric, congestion is not a bandwidth problem. It is a synchronization problem.
None of these behaviours appear in a link-level throughput test. They emerge from the interaction of topology, congestion-control tuning, buffer strategy, and the specific communication pattern of your workload: at scale, under load, and over hours.
Which is why most teams discover them after the hardware is racked.
The validation gap
Here is the position most infrastructure teams find themselves in.
You can validate components. You can confirm a switch forwards at line rate, an optical transceiver meets spec, or a NIC negotiates correctly. All necessary, but none of it tells you whether a 256-node training job will hit congestion collapse at the spine under a real AllReduce pattern.
The conventional options are all unsatisfying:
- Test with synthetic traffic. Generic load generators produce traffic that does not resemble collective communication. You validate the fabric against a workload you will never run.
- Test with the real cluster. This requires owning the GPUs first, meaning the capital is committed and the topology decisions are locked.
- Find out in production. The most common approach, and by a wide margin the most expensive.
What is missing is a way to observe system-level behaviour before the system physically exists.
A practical validation roadmap
The gap between “we know AI fabrics are different” and “we have proven ours works” is where most programs stall. Here is the sequence we recommend, and where each step fits in an existing network performance testing practice.
Step 1: Emulate the workload, not just the traffic. This is the foundational step, and the one most teams skip. Keysight, whose network test lineage runs back through Ixia, has extended that portfolio into AI infrastructure with KAI Data Center Builder. Rather than generating synthetic load, it emulates the actual collective operations training jobs run: AllReduce, AllGather, ReduceScatter, AlltoAll, Broadcast and Gather, across ring, tree, halving-doubling and PXN algorithms. Critically, it works with the collective communication libraries teams actually deploy, such as NCCL on NVIDIA, RCCL on AMD, or MSCCL on Microsoft, driving RDMA and RoCEv2 traffic across 400G, 800G and 1.6T fabrics.
The practical consequence is that you can model a topology before purchasing it: compare spine-leaf variations, oversubscription ratios, and switch vendors against the same repeatable workload, and see how job completion time responds.
Step 2: Look at the mechanisms, not just the throughput number. An aggregate bandwidth figure will not tell you why a job stalled. What you need is visibility into PFC pause behaviour, ECN and DCQCN response, retransmission counts, and ECMP hashing efficiency: the specific mechanisms that turn a healthy fabric into an idle cluster. Emulation platforms expose these directly, with hardware-based congestion notification and per-queue-pair rate control, so a congestion event becomes reproducible rather than anecdotal.
Step 3: Test without tying up accelerators. This is usually the strongest part of the business case. Software-based agents run directly on standard servers and scale horizontally, which means validating your fabric does not require a lab full of scarce, expensive GPUs. For an organization competing for accelerator supply, freeing that hardware for actual training work is not a minor consideration.
Step 3: Test without tying up accelerators. This is usually the strongest part of the business case. Software-based agents run directly on standard servers and scale horizontally, which means validating your fabric does not require a lab full of scarce, expensive GPUs. For an organization competing for accelerator supply, freeing that hardware for actual training work is a major consideration.
Step 4: Make your telemetry trustworthy with precision time. This one is easy to overlook and painful to retrofit. Diagnosing a distributed training stall means correlating events across hundreds of nodes, switch counters, and GPU telemetry streams. If those sources disagree about what time it is, reconstructing the sequence becomes guesswork. At the microsecond scale where congestion events unfold, ordinary NTP drift is enough to make a timeline meaningless. Resilient, GNSS-backed network time from partners like Safran ensures every log, capture, and counter shares one accurate, traceable clock. It is the same foundational control we have written about in the context of Zero Trust architecture, and it matters here for exactly the same reason.
Step 5: Carry the visibility into production. Pre-deployment validation tells you the design is sound. It does not tell you what changed last Tuesday. Network TAPs and packet brokers give your monitoring stack a complete, reliable copy of what is actually traversing the fabric, and platforms like StableNet maintain the live inventory and configuration baseline you will need when someone asks why throughput dropped 12% after a firmware update. Validation is not a gate you pass once: every speed upgrade, node expansion, and serving-stack change shifts the performance profile.
The other half of the bill: inference
Training gets the attention. Inference gets the recurring invoice.
For organizations running models in production, cumulative inference spend eventually exceeds the one-time training investment. Industry estimates commonly place inference at the large majority of lifetime compute cost, and the mechanism is straightforward: per-token costs keep falling, but token volume grows far faster, so the total bill climbs even as unit economics improve.
Inference also fails in ways users feel immediately. Time to first token determines whether an assistant feels responsive or broken. Concurrency limits determine whether the system holds up at 9am Monday. And the bottleneck could be almost anywhere — GPU compute, HBM bandwidth, KV-cache capacity, the PCIe or RDMA interconnect, the model engine, the orchestrator, the load balancer, or the security gateway sitting in front of all of it.
Open-source benchmarks will not find it. They run idealized, uniform workloads. Real users send prompts of wildly varying shape, in bursts, with patterns specific to the industry and application — which is why a model serving legal research behaves nothing like one serving customer support.
Keysight’s KAI Inference Builder addresses this by emulating realistic inference clients at production scale, using prompt libraries modelled on actual user behaviour across verticals including finance, legal, healthcare and academia. It validates the full path through firewalls, load balancers, and smart NICs, across both east-west and north-south traffic. It also correlates client-side metrics with inference engine telemetry such as vLLM statistics and GPU telemetry such as DCGM data in a single time-synchronized view.
That correlation is the point. It turns “inference feels slow” into a specific, actionable finding: the exact concurrency level where KV-cache saturates and time-to-first-token begins degrading past your target. One of those statements you can engineer against.
Getting the foundation right
Canada is committing billions of dollars and years of construction to AI infrastructure. The organizations building it are working to schedules set by funding cycles and power availability, not by how long careful validation takes.
That pressure is precisely why the validation step gets compressed — and precisely why it should not be. Every published MFU figure tells the same story: the gap between theoretical and realized performance is large even for the best-resourced teams in the world. Some of that gap is unavoidable. The portion attributable to fabric design is not, but it is only addressable while the design is still on paper.
Emulation is how you check the assumptions before the capital is committed, and how you keep checking as you scale. Not because testing is inherently virtuous, but because the alternative is discovering your model was wrong after it has been converted into steel, concrete, and fibre.
A few questions worth putting to your team this quarter:
- What MFU are we actually achieving during training runs, and have we decomposed the gap between network, memory, and kernel efficiency?
- When we deploy new switches, NICs, or nodes, how do we validate performance before production?
- If a training job slowed 30% tomorrow, how long would it take us to identify the root cause?
- Do we know our inference concurrency ceiling: the measured number, not an estimate?
- Are our logs and telemetry synchronized closely enough to reconstruct a congestion event after the fact?
If any of those produce an uncomfortable pause, that is the conversation worth having.
That’s where we can help. Telnet Networks has spent more than 25 years helping Canadian service providers, financial institutions, government agencies, and enterprises build networks that perform under pressure — and our partnership with Keysight extends that work into AI infrastructure validation. Our engineering team can walk through your environment, map where your current testing practice stops short of AI workload behaviour, and arrange a technical session with Keysight’s AI specialists.e stops short of AI workload behaviour, and arrange a technical session with Keysight’s AI specialists.
Planning a GPU cluster deployment or expansion? Contact the Telnet Networks team for a no-obligation consultation.
Further reading: the Canadian Sovereign AI Compute Strategy and the Government of Canada–TELUS sovereign AI announcement; Meta’s engineering write-up on RoCE networks for distributed AI training at scale; the PaLM paper for MFU methodology and comparative figures; Juniper’s Networking the AI Data Center white paper; and Keysight’s white papers on Benchmarking Collective Operations and Improving Scalability in AI Data Center Clusters.