Load Balancing Your Security Solution for Fun and Profit!

Maximizing the Value and Resiliency of Your Deployed Enterprise Security Solution with Intelligent Load Balancing

Correctly implementing your security solution in the presence of complex, high-volume user traffic has always been a difficult challenge for network architects. The data in transit on your network originates from many places and fluctuates with respect to data rates, complexity, and the occurrence of malicious events. Internal users create vastly different network traffic than external users using your publically available resources. Synthetic network traffic from bots has exceeded real users as the most prevalent creators of network traffic on the internet . How do you maximize your investment in a security solution while gaining the most value from the deployed solution? The answer is intelligent deployment through realistic preparation.

Let’s say that you have more than one point of ingress and egress into your network, and predicting traffic loads it is very difficult (since your employees and customers are global). Do you simply throw money at the problem by purchasing multiple instances of expensive network security infrastructure that could sit idle at times and then get saturated during others? A massive influx of user traffic could overwhelm your security solution in one rack, causing security policies to not be enforced, while the solution at the other point of ingress has resources to spare.

High speed inline security devices are not just expensive—the more features you enable on them the less network traffic they can successfully parse. If you start turning on features like sandboxing (which spawns virtual machines to deeply analyze potential new security events) you can really feel the pain.

Using a network packet broker with load balancing capability with multiple inline Next Generation Firewalls (NGFW) into a single logical solution, allows you to maximize your secruity investment.  To test the effectiveness we ran 4 scenerio’s using an advanced featured packet broker and load testing tools to see how effective this strategy is.

TESTING PLATFORM

Usung two high end NGFWs, we enabled nearly every feature (including scanning traffic for attacks, identifying user applications, and classifying network security risk based on the geolocation of the client) and load balanced the two devices using an advanced featured packet broker. Then using our load testing tools we created all of my real users and a deluge of different attack scenarios.  Below are the results of 4 testing scenerios

Scenario One: Traffic Spikes

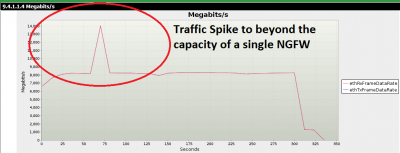
Your 10GbE NGFW will experience inconsistent amounts of network traffic. It is crucial to be able effectively inforce security policies during such events. In the first test I created a baseline of 8Gbps of real user traffic, then introduced a large influx of traffic that pushed the overall volume to 14Gbps. The packet broker load balancer ensured that the traffic was split between the two NGFWs evenly, and all of my security policies were enforced.

Load Balancing Your Security Solution for Fun and Profit!

Figure 1: Network traffic spike

Scenario Two: Endurance Testing

Handling an isolated event is interesting, but maintaining security effectiveness over long periods of time is crucial for a deployed security solution. In the next scenario, I ran all of the applications I anticipated on my network at 11Gbps for 60 hours. The packet broker gave each of my NGFWs just over 5Gbps of traffic, allowing all of my policies to be enforced. Of the 625 million application transactions attempted throughout the duration of the test, users enjoyed a 99.979% success rate.

Load Balancing Your Security Solution for Fun and Profit!

Figure 2: Applications executed during 60 hour endurance test

Scenario Three: Attack Traffic

Where the rubber meets the road for a security solution is during an attack. Security solutions are insurance policies against network failure, data exfiltration, misuse of your resources, and loss of reputation. I created a 10Gbps baseline of the user traffic (described in Figure 2) and added a curveball by launching 7261 remote exploits from one zone to another. Had these events not been load balanced with the packet broker, a single NGFW might have experienced the entire brunt of this attack. The NGFW could have been overwhelmed and failed to inforce policies. The NGFW might have been under such duress mitigating the attacks that legitimate users would have been collateral damage of the NGFW attempting to inforce policies. The deployed solution performed excellently, mitigating all but 152 of my attacks.

Concerning the missed 152 attacks: the load testing tool library contains a comprehensive amount of undisclosed exploits. That being said, as with the 99.979% application success rate experienced during the endurance test, nothing is infallible. If my test worked with 100% success, I wouldn’t believe it and neither should you.

Load Balancing Your Security Solution for Fun and Profit!

Figure 3: Attack success rate

Scenario Four: The Kitchen Sink

Life would indeed be rosy if the totality of a content aware security solution was simply making decisions between legitimate users and known exploits. For my final test I added another wrinkle. The solution also had to deal with large volume of fuzzing to my existing deluge of real users and attacks. Fuzzing is the concept of sending intentionally flawed network traffic through a device or at an endpoint with the hopes of uncovering a bug that could lead to a successful exploitation. Fuzzed traffic can be as simple as incorrectly advertised packet lengths, to erroneously crafted application transactions. My test included those two scenarios and everything in between. The goal of this test was stability. I achieved this by mixing 400Mbps of pure chaos via load testing fuzzing engine, with Scenario Three’s 10Gbps of real user traffic and exploits. I wanted to make certain that my load-balanced pair of NGFWs were not going to topple over when the unexpected took place.

The results were also exceptionally good. Of the 804 million application transactions my users attempted, I only had 4.5 million go awry—leaving me with a 99.436% success rate. This extra measure of maliciousness only changed the user experience by increasing the failures by about ½ of a percent. Nothing crashed and burned.

Load Balancing Your Security Solution for Fun and Profit!

Figure 4: Application Success rates during the “Kitchen Sink” test

Conclusion

All four of the above scenarios illustrate how you can enhance the effectiveness of a security solution while maximizing your budget. However, we are only scratching the surface. What if you needed your security solution to be deployed in a High Availability environment? What if the traffic your network services expand? Setting up the packet broker to operate in HA or adding additional inline security solutions to be load balanced is probably the most effective and affordable way of addressing these issues.

Let us know if you are intrested in seeing a live demonstration of a packet broker load balancing attacks from secruity testing tool over multiple inline security solutions? We would be happy to show you how it is done.

Additional Resources:

Network Packet Brokers

CyPerf

Don’t Be Lulled to Sleep with a Security Fable. . .

Once upon a time, all you needed was a firewall to call yourself “secure.” But then, things changed. More networks are created every day, every network is visible to the others, and they connect with each other all the time—no matter how far away or how unrelated.

And malicious threats have taken notice . . .

As the Internet got bigger, anonymity got smaller. It’s impossible to go “unnoticed” on the Internet now. Everybody is a target.

Into today’s network landscape, every network is under the threat of attack all the time. In reaction to threats, the network “security perimeter” has expanded in reaction to new attacks, new breeds of hackers, more regions coming online, and emerging regulations.

Security innovation tracks threat innovation by creating more protection—but this comes with more complexity, more maintenance, and more to manage. Security investment rises with expanding requirements. Just a firewall doesn’t nearly cut it anymore.

Next-generation firewalls, IPS/IDS, antivirus software, SIEM, sandboxing, DPI: all of these tools have become part of the security perimeter in an effort to stop traffic from getting in (and out) of your network. And they are overloaded, and overloading your security teams.

In 2014, there were close to 42.8 million cyberattacks (roughly 117,339 attacks each day) in the United States alone. These days, the average North American enterprise fields around 10,000 alerts each day from its security systems—way more than their IT teams can possibly process—a Damballa analysis of traffic found.

Your network’s current attack surface is huge. It is the sum of every access avenue an attacker could use to enter your network (or take data out of your network). Basically, every connection to and/or from anywhere.

There are two types of traffic that hit every network: The traffic worth analyzing for threats, and the traffic not worth analyzing for threats that should be blocked immediately before any security resource is wasted inspecting or following up on it.

Any way to filter out traffic that is either known to be good or known to be bad, and doesn’t need to go through the security system screening, reduces the load on your security staff. With a reduced attack surface, your security resources can focus on a much tighter band of information, and not get distracted by non-threatening (or obviously threatening) noise.

Thanks to Ixia for the article.

The State of Enterprise Security Resilience – An Ixia Research Report

Ixia, an international leader in application performance and security resilience technology, conducted a survey to better understand how network security resilience solutions and techniques are used within the modern enterprise. While information exists on security products and threats, very little is available on how it is actually being used and the techniques and technology to ensure that security is completely integrated into the corporate network structure. This report presents the research we uncovered.

During this survey, there were three areas of emphasis exploring security and visibility architectures. One portion of the survey focused on understanding the product types and use. The second area of emphasis was on understanding the processes in use. The final area of emphasis was on understanding the people components of typical architectures.

This report features several key findings that include the following:

  • Many enterprises and carriers are still highly vulnerable to the effects of a security breach. This is due to concerns with lack of following best practices, process issues, lack of awareness, and lack of proper technology.
  • Lack of knowledge, not cost, is the primary barrier to security improvements. However, typical annual spend on network security is less than $100K worldwide.
  • Security resilience approaches are growing in worldwide adoption. A primary contributor is the merge of visibility and security architectures. Additional data shows that life-cycle security methodologies and security resilience testing are also positive contributors.
  • The top two main security concerns for IT are data loss and malware attacks.

These four key findings confirm that while there are still clear dangers to network security in the enterprise, there is some hope for improvement. The severity of the risk has not gone away, but it appears that some are managing it with the right combination of investment in technology, training, and processes.

To read more, download the report here.

The State of Enterprise Security Resilience

Thanks to Ixia for the article.

What if Sony Used Ixia’s Application and Threat Intelligence Processor (ATIP)?

Trying to detect intrusions in your network and extracting data from your network is a tricky business. Deep insight requires a deep understanding of the context of your network traffic—where are connections coming from, where are they going, and what are the specific applications in use. Without this breadth of insight, you can’t take action to stop and remediate attacks, especially from Advanced Persistent Threats (APT).

To see how Ixia helps its customers gain this actionable insight into the applications and threats on their network, we invite you to watch this quick demo of Ixia’s Application and Threat Intelligence Processor (ATIP) in action. Chief Product Officer Dennis Cox uses Ixia’s ATIP to help you understand threats in real time, with the actual intrusion techniques employed in the Sony breach.

Additional Resources:

Ixia Application and Threat Intelligence Processor

Thanks to Ixia for the article.

Application Intelligence Supercharges Network Security

I was recently at a conference where the topic of network security came up again, like it always does. It seems like there might be a little more attention on it now, not really due to the number of breaches—although that plays into a little—but more because companies are being held accountable for allowing the breaches. Examples include Target (where both the CIO and CEO got fired over that breach in 2013) and the fact that the FCC and FTC are fining companies (like YourTel America, TerraCom, Presbyterian Hospital, and Columbia University) that allow a breach to compromise customer data.

This is an area where application intelligence could be used to help IT engineers. Just to be clear, application intelligence won’t fix ALL of your security problems, but it can give you additional and useful information that was very difficult to ascertain before now. For those that haven’t heard about application intelligence, this technology is available through certain network packet brokers (NPBs). It’s an extended functionality that allows you to go beyond Layer 2 through 4 (of the OSI model) packet filtering to reach all the way into Layer 7 (the application layer) of the packet data.

The benefit here is that rich data on the behavior and location of users and applications can be created and exported in any format needed—raw packets, filtered packets, or NetFlow information. IT teams can identify hidden network applications, mitigate network security threats from rogue applications and user types, and reduce network outages and/or improve network performance due to application data information.

Application Intelligence Supercharges Network SecurityIn short, application intelligence is basically the real-time visualization of application level data. This includes the dynamic identification of known and unknown applications on the network, application traffic and bandwidth use, detailed breakdowns of applications in use by application type, and geo-locations of users and devices while accessing applications.
Distinct signatures for known and unknown applications can be identified, captured, and passed on to specialized monitoring tools to provide network managers a complete view of their network. The filtered application information is typically sent on to 3rd party monitoring tools (e.g. Plixer, Splunk, etc.) as NetFlow information but could also be consumed through a direct user interface in the NPB. The benefit to sending the information to 3rd party monitoring tools is that it often gives them more granular, detailed application data than they would have otherwise to improve their efficiency.

With the number of applications on service provider and enterprise networks rapidly increasing, application intelligence provides unprecedented visibility to enable IT organizations to identify unknown network applications. This level of insight helps mitigate network security threats from suspicious applications and locations. It also allows IT engineers to spot trends in application usage which can be used to predict, and then prevent, congestion.

Application intelligence effectively allows you to create an early warning system for real-time vigilance. In the context of improving network security, application intelligence can provide the following benefits:

  • Identify suspicious/unknown applications on the network
  • Identify suspicious behavior by correlating connections with geography and known bad sites
  • Identify prohibited applications that may be running on your network
  • Proactively identify new user applications consuming network resources

Application Intelligence Supercharges Network Security

A core feature of application intelligence is the ability to quickly identify ALL applications on a network. This allows you to know exactly what is or is not running on your network. The feature is often an eye opener for IT teams, and they are surprised to find out that there are actually applications on their network they knew nothing about. Another key feature is that all applications are identified by a signature. If the application is unknown, a signature can be developed to record its existence. These unknown application signatures should be the first step as part of IT threat detection procedures so that you can identify any hidden/unknown network applications and user types. The ATI Processor correlates applications with geography, and can identify compromised devices and malicious activities such as Command and Control (CNC) communications from malicious botnet activities.

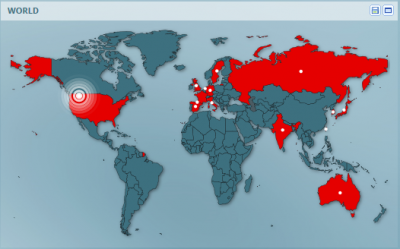
A second feature of application intelligence is the ability to visualize the application traffic on a world map for a quick view of traffic sources and destinations. This allows you to isolate specific application activity by granular geography (country, region, and even neighborhood). User information can then be correlated with this information to further identify and locate rogue traffic. For instance, maybe there is a user in North Korea that is hitting an FTP server in Dallas, TX and transferring files off network. If you have no authorized users in North Korea, this should be treated as highly suspicious. At this point, you can then implement your standard security protocols—e.g., kill the application session immediately, capture origin and destination information, capture file transfer information, etc.

Another way of using application intelligence is to audit your network policies and usage of those policies. For instance, maybe your official policy is for employees to use Outlook for email. All inbound email traffic is then passed through an anti-viral/malware scanner before any attachments are allowed entry into the network. With application intelligence, you would be able to tell if users are following this policy or whether some are using Google mail and downloading attachments directly through that service, which is bypassing your malware scanner. Not only would this be a violation of your policies, it presents a very real threat vector for malware to enter your network and commence its dirty work.

Ixia’s Application and Threat Intelligence (ATI) Processor brings intelligent functionality to the network packet broker landscape with its patent pending technology that dynamically identifies all applications running on a network. The Ixia ATI Processor is a 48 x 10GE interface card that can be used standalone in a compact 1 rack unit high chassis or within an Ixia Net Tool Optimizer (NTO) 7300 network packet broker (NPB) for a high port density option.

As new network security threats emerge, the ATI Processor helps IT improve their overall security with better intelligence for their existing security tools. To learn more, please visit the ATI Processor product page or contact us to see a demo!

Additional Resources:

Thanks to Ixia for the article.

Visibility Architectures Enable Real-Time Network Vigilance

Ixia's Network Visibility Architecture

A couple of weeks ago, I wrote a blog on how to use a network lifecycle approach to improve your network security. I wanted to come back and revisit this as I’ve had a few people ask me why the visibility architecture is so important. They had (incorrectly, IMO) been told by others to just focus on the security architecture and everything else would work out fine.

The reason you need a visibility architecture in place is because if you are attacked, or breached, how will you know? During a DDoS attack you will most likely know because of website performance problems, but most for most of the other attacks how will you know?

This is actually a common problem. The 2014 Trustwave Global Security Report stated that 71% of compromised victims did not detect the breach themselves—they had no idea and attack had happened. The report also went on to say that the median number of days from initial intrusion to detection was 87! So most companies never detected the breach on their own (they had to be told by law enforcement, a supplier, customer, or someone else), and it took almost 3 months after the breach for that notification to happen. This doesn’t sound like the optimum way to handle network security to me.

The second benefit of a visibility architecture is faster remediation once you discover that you have been breached. In fact, some Ixia customers have seen an up to 80% reduction in their mean time to repair performance due to implementing a proper visibility architecture. If you can’t see the threat, how are you going to respond to it?

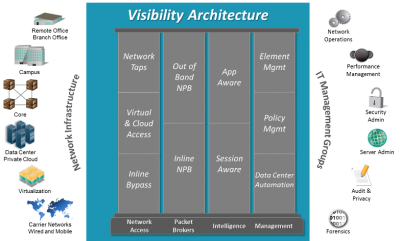
A visibility architecture is the way to solve these problems. Once you combine the security architecture with the visibility architecture, you equip yourself with the necessary tools to properly visualize and diagnose the problems on your network. But what is a visibility architecture? It’s a set of components and practices that allow you to “see” and understand what is happening in your network.

The basis of a visibility architecture starts with creating a plan. Instead of just adding components as you need them at sporadic intervals (i.e., crisis points), step back and take a larger view of where you are and what you want to achieve. This one simple act will save you time, money and energy in the long run.

Ixia's Network Visibility Architecture

The actual architecture starts with network access points. These can be either taps or SPAN ports. Taps are traditionally better because they don’t have the time delays, summarized data, duplicated data, and the hackability that are inherent within SPAN ports. However, there is a problem if you try to connect monitoring tools directly to a tap. Those tools become flooded with too much data which overloads them, causing packet loss and CPU overload. It’s basically like drinking from a fire hose for the monitoring tools.

This is where the next level of visibility solutions, network packet brokers, enter the scene. A network packet broker (also called an NPB, packet broker, or monitoring switch) can be extremely useful. These devices filter traffic to send only the right data to the right tool. Packets are filtered at the layer 2 through layer 4 level. Duplicate packets can also be removed and sensitive content stripped before the data is sent to the monitoring tools if that is required as well. This then provides a better solution to improve the efficiency and utility of your monitoring tools.

Access and NPB products form the infrastructure part of the visibility architecture, and focus on layer 2 through 4 of the OSI model. After this are the components that make up the application intelligence layer of a visibility architecture, providing application-aware and session-aware visibility. This capability allows filtering and analysis further up the stack at the application layer, (layer 7). This is only available in certain NPBs. Depending upon your needs, it can be quite useful as you can collect the following information:

  • Types of applications running on your network
  • Bandwidth each application is consuming
  • Geolocation of application usage
  • Device types and browsers in use on your network
  • Filter data to monitoring tools based upon the application type

These capabilities can give you quick access to information about your network and help to maximize the efficiency of your tools.

These layer 7 application oriented components provide high-value contextual information about what is happening with your network. For example, this type of information can be used to generate the following benefits:

  • Maximize the efficiency of current monitoring tools to reduce costs
  • Gather rich data about users and applications to offer a better Quality of Experience for users
  • Provide fast, easy to use capabilities to spot check for security & performance problems

Ixia's Network Visibility Architecture

And then, of course, there are the management components that provide control of the entire visibility architecture: everything from global element management, to policy and configuration management, to data center automation and orchestration management. Engineering flexible management for network components will be a determining factor in how well your network scales.

Visibility is critical to this third stage (the production network) of your network’s security lifecycle that I referred to in my last blog. (You can view a webinar on this topic if you want.) This phase enables the real-time vigilance you will need to keep your network protected.

As part of your visibility architecture plan, you should investigate and be able to answer these three questions.

  1. Do you want to be proactive and aggressively stop attacks in real-time?
  2. Do you actually have the personnel and budget to be proactive?
  3. Do you have a “honey pot” in place to study attacks?

Depending upon those answers, you will have the design of your visibility architecture. As you can see from the list below, there are several different options that can be included in your visibility architecture.

  • In-line components
  • Out-of-band components
  • Physical and virtual data center components
  • Layer 7 application filtering
  • Packet broker automation
  • Monitoring tools

In-line and/or out-of-band security and monitoring components will be your first big decision. Hopefully everybody is familiar with in-line monitoring solutions. In case you aren’t, an in-line (also called bypass) tap is placed in-line in the network to allow access for security and monitoring tools. It should be placed after the firewall but before any equipment. The advantage of this location is that should a threat make it past the firewall, that threat can be immediately diverted or stopped before it has a chance to compromise the network. The tap also needs to have heartbeat capability and the ability to fail closed so that should any problems occur with the device, no data is lost downstream. After the tap, a packet broker can be installed to help traffic to the tools. Some taps have this capability integrated into them. Depending upon your need, you may also want to investigate taps that support High Availability options if the devices are placed into mission critical locations. After that, a device (like an IPS) is inserted into the network.

In-line solutions are great, but they aren’t for everyone. Some IT departments just don’t have enough personnel and capabilities to properly use them. But if you do, these solutions allow you to observe and react to anomalies and problems in real-time. This means you can stop an attack right away or divert it to a honeypot for further study.

The next monitoring solution is an out-of-band configuration. These solutions are located further downstream within the network than the in-line solutions. The main purpose of this type of solution is to capture data post event. Depending whether interfaces are automated or not, it is possible to achieve near real-time capabilities—but they won’t be completely real-time like the in-line solutions are.

Nevertheless, out-of-band solutions have some distinct and useful capabilities. The solutions are typically less risky, less complicated, and less expensive than in-line solutions. Another benefit of this solution is that it gives your monitoring tools more analysis time. Data recorders can capture information and then send that information to forensic, malware and/or log management tools for further analysis.

Do you need to consider monitoring for your virtual environments as well as your physical ones? Virtual taps are an easy way to gain access to vital visibility information in the virtual data center. Once you have the data, you can forward it on to a network packet broker and then on to the proper monitoring tools. The key here is apply “consistent” policies for your virtual and physical environments. This allows for consistent monitoring policies, better troubleshooting of problems, and better trending and performance information.

Other considerations are whether you want to take advantage of automation capabilities, and do you need layer 7 application information? Most monitoring solutions only deliver layer 2 through 4 packet data, so layer 7 data could be very useful (depending upon your needs).

Application intelligence can be a very powerful tool. This tool allows you to actually see application usage on a per-country, per-state, and per-neighborhood basis. This gives you the ability to observe suspicious activities. For instance, maybe an FTP server is sending lots of files from the corporate office to North Korea or Eastern Europe—and you don’t have any operations in those geographies. The application intelligence functionality lets you see this in real time. It won’t solve the problem for you, but it will let you know that the potential issue exists so that you can make the decision as to what you want to do.

Another example is that you can conduct an audit for security policy infractions. For instance, maybe your stated process is for employees to use Outlook for email. You’ve then installed anti-malware software on a server to inspect all incoming attachments before they are passed onto users. With an application intelligence product, you can actually see if users are connecting to other services (maybe Gmail or Dropbox) and downloading files through that application. This practice would bypass your standard process and potentially introduce a security risk to your network. Application intelligence can also help identify compromised devices and malicious botnet activities through Command and Control communications.

Automation capability allows network packet brokers to be automated to initiate functions (e.g., apply filters, add connections to more tools, etc.) in response to external commands. This automation allows a switch/controller to make real-time adjustments to suspicious activities or problems within the data network. The source of the command could be a network management system (NMS), provisioning system, security information and event management (SIEM) tool or some other management tool on your network that interacts with the NPB.

Automation for network monitoring will become critical over the next several years, especially as more of the data center is automated. The reasons for this are plain: how do you monitor your whole network at one time? How do you make it scale? You use automation capabilities to perform this scaling for you and provide near real-time response capabilities for your network security architecture.

Finally, you need to pick the right monitoring tools to support your security and performance needs. This obviously depends the data you need and want to analyze.

The life-cycle view discussed previously provides a cohesive architecture that can maximize the benefits of visibility like the following:

  • Decrease MTTR up to 80% with faster analysis of problems
  • Monitor your network for performance trends and issues
  • Improve network and monitoring tool efficiencies
  • Application filtering can save bandwidth and tool processing cycles
  • Automation capabilities, which can provide a faster response to anomalies without user administration
  • Scale network tools faster

Once you integrate your security and visibility architectures, you will be able to optimize your network in the following ways:

  • Better data to analyze security threats
  • Better operational response capabilities against attacks
  • The application of consistent monitoring and security policies

Remember, the key is that by integrating the two architectures you’ll be able to improve your root cause analysis. This is not just for security problems but all network anomalies and issues that you encounter.

Additional Resources

  • Network Life-cycle eBook – How to Secure Your Network Through Its Life Cycle
  • Network Life-cycle webinar – Transforming Network Security with a Life-Cycle Approach
  • Visibility Architecture Security whitepaper – The Real Secret to Securing Your Network
  • Security Architecture whitepaper – How to Maximize IT Investments with Data-Driven Proof of Concept (POC)
  • Security solution overview – A Solution to Network Security That Actually Works
  • Cyber Range whitepaper – Accelerating the Deployment of the Evolved Cyber Range

Thanks to Ixia for the article. 

5 Ways to Use APM for Post-Event Security Forensics

Most security experts agree that the rapidly changing nature of malware, hack attacks and government espionage practically guarantees your IT infrastructure will be compromised. According to the 2014 Cost of Data Breach Study conducted by the Ponemon Institute, the average detection, escalation and notification costs for a breach is approximately $1 million. Post-incident costs averaged $1.6 million.

Once an attacker is within the network, it can be very difficult to identify and eliminate the threat without deep-packet inspection. The right Application Performance Management (APM) solution that includes network forensics can help IT operations deliver superior performance for users, and when incorporated into your IT security initiatives, deep packet inspection can provide an extra level of support to existing antivirus software, Intrusion Detection System (IDS) and Data Loss Prevention (DLP) solutions. The ability to capture and store all activity that traverses your IT infrastructure acts like a 24/7 security camera that enables your APM tool to serve as a backstop to your business’ IT security efforts if other lines of defense fail.

To use APM solutions for security forensics for post-event analysis, you must have a network retrospective analyzer that has at least the following capabilities:

  • High-speed (10 Gb and 40 Gb) data center traffic capture
  • Expert analytics of network activity with deep packet inspection
  • Filtering using Snort or custom user defined rules
  • Event replay and session reconstruction

Capacity to store massive amounts of traffic data (we’re potentially talking petabytes) for post-event analysis

Like utilizing video footage from a surveillance camera, captured packets and analysis of network conversations can be retained and looked at retrospectively to detect, clean up and provide detailed information of a breach. This back-in-time analysis can be especially important if the threat comes from within, such as a disgruntled employee within a company firewall. It also allows companies to determine exactly what data was compromised and help in future prevention.

Below are five ways to use network monitoring and analysis to investigate breaches:

  1. Identify changes in overall network traffic behavior, such as applications slowing down that could be a sign of an active security breach.
  2. Detect unusual individual user’s account activity; off-hour usage, large data transfers, or attempts to access unauthorized systems or services — actions often associated with disgruntled employees or a hacked account.
  3. Watch for high-volume network traffic at unusual times, it could be a rogue user in the process of taking sensitive data or stealing company IP.
  4. View packet capture of network conversations to determine how the breach occurred and develop strategies to eliminate future threats by strengthening the primary IT security.
  5. Discover what infrastructure, services, and data were exposed to aid in resolution, notification, and regulatory compliance.

By incorporating retrospective network analysis, companies can use their network monitoring as a back stop to IDS and DLP solutions, and accelerate detection and resolution.

Thanks to APM Digest for the article.