Security Breaches Keep Network Teams Busy

Network Instruments study shows that network engineers are spending more of their day responding to breaches and deploying security controls.

This should come as no big surprise to most network teams. As security breaches and threats proliferate, they’re spending a lot of time dealing with security issues, according to a study released Monday.

Network Instruments’ eighth annual state of the network report shows that network engineers are increasingly consumed with security chores, including investigating security breaches and implementing security controls. Of the 322 network engineers, IT directors and CIOs surveyed worldwide, 85% said their organization’s network team was involved in security. Twenty percent of those polled said they spend 10 to 20 hours per week on security issues.

Security Breaches Keep Network Teams Busy

Almost 70% said the time they spend on security has increased over the past 12 months; nearly a quarter of respondents said the time spend increased by more than 25%.

The top two security activities keeping networking engineers busy are implementing preventative measures and investigating attacks, according to the report. Flagging anomalies and cleaning up after viruses or worms also are other top time sinks for network teams.

“Network engineers are being pulled into every aspect of security,” Brad Reinboldt, senior product manager for Network Instruments, the performance management unit of JDSU, said in a prepared statement

Security Breaches Keep Network Teams Busy

Network teams are drawn into security investigations and preparedness as high-profile security breaches continue to make headlines. Last year, news of the Target breach was followed by breach reports from a slew of big-name companies, including Neiman Marcus, Home Depot, and Michaels.

A report issued last September by the Ponemon Institute and sponsored by Experian showed that data breaches are becoming more frequent. Of the 567 US executives surveyed, 43 percent said they had experienced a data breach, up from 33% in a similar survey in 2013. Sixty percent said their company had suffered more than one data breach in the past two years, up from 52% in 2013.

According to Network Instruments’ study, syslogs were as the top method for detecting security issues, with 67% of survey respondents reporting using them. Fifty-seven percent use SNMP while 54% said they use anomalies for uncovering security problems.

In terms of security challenges, half of the survey respondents ranked correlating security and network performance as their biggest problem.

The study also found that more than half of those polled expect bandwidth to grow by more than 51% next year, up from the 37% from last year’s study who expected that kind of growth. Several factors are driving the demand, including users with multiple devices, larger data files, and unified communications applications, according to the report.

The survey also queried network teams about their adoption of emerging technologies. It found that year-over-year implementation rates for 40 Gigabit Ethernet, 100GbE, and software-defined networking have almost doubled. One technology that isn’t gaining traction among those polled is 25 GbE, with more than 62% saying they have no plans for it.

Thanks to Network Computing for the article.

End User Experience Testing Made Easier with NMSaaS

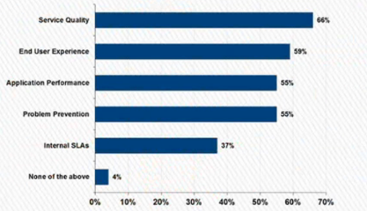
End user experience & QoS are consistently ranked at the top of priorities for Network Management teams today. According to research over 60% of companies today say that VoIP is present in a significant amount of their networks, this is the same case with streaming media within the organization.

As you can see having effective end user experience testing is vital to any business. If you have a service model, whether you’re an actual service provider like a 3rd party or you’re a corporation where your IT acts as a service provider you have a certain goal. This goal is to provide assured applications/services to your customers at the highest standard possible.

The success of your business is based upon your ability to deliver effective end user experience. How many times have you been working with a business and have been told to wait because the businesses computers systems were “slow”. It is something which we all have become frustrared with in the past.

b2ap3_thumbnail_angry-user-post-size.jpg

To ensure that your organization can provide effective and successful end user experience you need to be able to proactively test your live environment and be alerted to issues in real time.

This is comprised of 5 key elements:

1) Must be able to test from end-to-end

2) Point to Point or Meshed testing

3) Real traffic and “live” test, not just “ping” and trace route

4) Must be able to simulate the live environments

  • Class of service
  • Number of simultaneous tests
  • Codecs
  • Synthetic login/query

5) Must be cost effective and easy to deploy.

NMSaaS is able to provide all of these service at a cost effective price.

If this is something you might be interested in, or if you would like to find more about our services and solutions – why not start a free 30 day trial today?

b2ap3_thumbnail_file-2229790027.png

Thanks to NMSaaS for the article.

Avoid Network Performance Problems with Automated Monitoring

Network administrators can streamline the troubleshooting process by deploying automated monitoring systems.

With automated monitoring in place, admins can get early warnings about emerging problems and address them before the adverse effects continue for too long. In addition, automated monitoring can help maintain up to date information about network configuration and devices on the network that can be essential for diagnosing network performance problems.

An automated network monitoring regime requires a combination of tools along with policies and procedures for utilizing those tools.

Network hardware vendors and third party software vendors offer a wide range of tools for network management. Here are some tips for identifying the right tool, or set of tools, for your needs.

The first step in setting up automated monitoring system is having an accurate inventory of devices on your network. A key requirement for just about any automated network tool set is automated discovery of IP addressable devices. This includes network hardware, like switches and routers, as well as servers and client devices.

Another valuable feature is the ability to discover network topology. If you cringe every time someone erases your network diagram from the whiteboard, it’s probably time to get a topology mapping tool. Topology discovery may be included with your device discovery tool but not necessarily.

Device and topology discovery tools provide a baseline of information about the structure of your network. These tools can be run at regular intervals to detect changes and update the device database and topology diagrams. As a side benefit, this data can be useful for compliance reporting as well.

Once you have an inventory of devices on your network, you will need to collect data on the state of those devices. Although IT organizations often separate network administration and server administration duties, it is often helpful to have performance data on servers and the network.

The Simple Network Management Protocol (SNMP) and the Windows Management Instrumentation (WMI) protocols are designed to collect such device data. Network performance monitoring tools can be configured to poll network devices and collect data on availability, latency and traffic volumes using SNMP. WMI is a Microsoft protocol designed to allow monitoring programs to query Windows operating systems about the state of a system. Network performance monitoring tools can collect, consolidate and correlate network and server information from multiple devices.

In addition to monitoring the state of servers, some tools support running Powershell monitoring and action scripts for Windows devices and SSH support for administering Linux servers.

Thanks to Tom’s IT Pro for the article.

Will You Find the Needle in the Haystack? Visibility with Overlapping Filters

When chasing security or performance issues in a data center, the last thing you need is packet loss in your visibility fabric. In this blog post I will focus on the importance of how to deal with multiple tools with different but overlapping needs.

Dealing with overlapping filters is critical, in both small and large visibility fabrics. Lost packets occur when filter overlaps are not properly considered. Ixia’s NTO is the only visibility platform that dynamically deals with all overlaps to ensure that you never miss a packet. Ixia Dynamic Filters ensure complete visibility to all your tools all the time by properly dealing with “overlapping filters.” Ixia has over 7 years invested in developing and refining the filtering architecture of NTO, it’s important to understand the problem of overlapping filters.

What are “overlapping filters” I hear you ask? This is easiest explained with a simple example. Let’s say we have 1 SPAN port, 3 tools, and each tool needs to see a subset of traffic:

Will You Find the Needle in the Haystack? Visibility with Overlapping Filters

Sounds simple, we just want to describe 3 filter rules:

  • Tool 1 wants a copy of all packets on VLAN 1-3
  • Tool 2 wants a copy of all packets containing TCP
  • Tool 3 wants a copy of all packets on VLAN 3-6

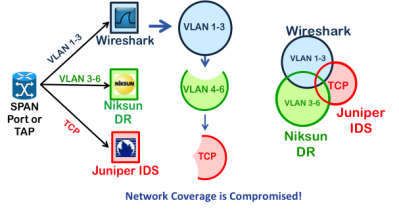
Notice the overlaps. For example a TCP packet on VLAN 3 should go to all three tools. If we just installed these three rules we would miss some traffic because of the overlaps. This is because once a packet matches a rule the hardware takes the forwarding action and moves on to examine the next packet.

This is what happens to the traffic when overlaps are ignored. Notice that while the WireShark tool gets all of its traffic because its rule was first in the list, the NikSun and Juniper tools will miss some packets. The Juniper IDS will not see any of the traffic on VLANs 1-6, and the Niksun will not receive packets on VLAN 3. This is bad.

Will You Find the Needle in the Haystack? Visibility with Overlapping Filters

To solve this we need to describe all the overlaps and put them in the right order. This ensures each tool gets a full view of the traffic. The three overlapping filters above result in seven unique rules as shown below. By installing these rules in the right order, each tool will receive a copy of every relevant packet. Notice we describe the overlaps first as the highest priority.

Will You Find the Needle in the Haystack? Visibility with Overlapping Filters

Sounds simple but remember this was a very simple example. Typically there are many more filters, lots of traffic sources, multiple tools, and multiple users of the visibility fabric. As well changes need to happen on the fly easily and quickly without impacting other tools and users.

A simple rule list quickly explodes into thousands of discrete rules. Below you can see two tools and three filters with ranges that can easily result in 1300 prioritized rules. Not something a NetOps engineer needs to deal with when trying to debug an outage at 3am!

Will You Find the Needle in the Haystack? Visibility with Overlapping FiltersConsider a typical visibility fabric with 50 taps, eight tools, and one operations department with three users. Each user needs to not impact the traffic of other users, and each user needs to be able to quickly select the types of traffic they need to secure and optimize in the network.

With traditional rules-based filtering this becomes impossible to manage.

Ixia NTO is the only packet broker that implements Dynamic Filters; other visibility solutions implement rules with a priority. This is the result of many years of investment in filtering algorithms. Here’s the difference:

  • Ixia Dynamic Filters are a simple description of the traffic you want, without any nuance of the machine that selects the traffic for you, other filter interactions, or the complications brought by overlaps.
  • Priority-based rules are lower level building blocks of filters. Rules require the user to understand and account for overlaps and rule priority to select the right traffic. Discrete rules quickly become headaches for the operator.

Ixia Dynamic Filters remove all the complexity by creating discrete rules under the hood, and a filter may require many discrete rules. The complex mathematics required to determine discrete rules and priority are calculated in seconds by software, instead of taking days of human work. Ixia invented the Dynamic filter more than seven years ago, and has been refining and improving it ever since. Dynamic Filtering software allows us to take into account the most complex filtering scenarios in a very simple and easy-to-manage way.

Another cool thing about Ixia Dynamic filter software is that it becomes the underpinnings for an integrated drag and drop GUI and REST API. Multiple users and automation tools can simultaneously interact with the visibility fabric without fear of impacting each other.

Some important characteristics of Ixia’s Dynamic Filtering architecture:

NTO Dynamic Filters handle overlaps automatically—No need to have a PhD to define the right set of overlapping rules.

NTO Dynamic Filters have unlimited bandwidth—Many ports can aggregate to a single NTO filter which can feed multiple tools, there will be no congestion or dropped packets.

NTO Dynamic Filters can be distributed—Filters can span across ports, line cards and distributed nodes without impact to bandwidth or congestion.

NTO allows a Network Port to connect to multiple filters—You can do this:

Will You Find the Needle in the Haystack? Visibility with Overlapping Filters

NTO has 3 stage filtering—Additional filters at the network and tool ports.

NTO filters allow multiple criteria to be combined using powerful boolean logic—Users can pack a lot of logic into a single filter. Each stage supports Pass and Deny AND/OR filters with ‘Source or Destination’, session, and multi-part uni/bi-directional flow options. Dynamic filters also support passing any packets that didn’t match any other Pass filter, or that matched all Deny filters.

NTO Custom Dynamic Filters cope with offsets intelligently—filter from End of L2 or start of L4 Payload skipping over any variable length headers or tunnels. Important for dealing with GTP, MPLS, IPv6 header extensions, TCP options, etc.

NTO Custom Dynamic Filters handle tunneled MPLS and GTP L3/L4 fields at line rate on any port—use pre-defined custom offset fields to filter on MPLS labels, GTP TEIDs, and inner MPLS/GTP IP addresses and L4 ports on any standard network port interface.

NTO provides comprehensive statistics at all three filter stages—statistics are so comprehensive you can often troubleshoot your network based on the data from Dynamic filters alone. NTO displays packet/byte counts at the input and output of each filter along with rates, peak, and charts. The Tool Management View provides a detailed breakdown of the packets/bytes being fed into a tool port by its connected network ports and dynamic filters.

In summary the key benefits you get with Ixia Dynamic filters are:

  • Accurately calculates required rules for overlapping filters, 100% of the time.
  • Reduces time taken to correctly configure rules from days to seconds.
  • Removes human error when trying to get the right traffic to the right tool.
  • Hitless filter installation, doesn’t drop a single packet when filters are installed or adjusted
  • Easily supports multiple users and automation tools manipulating filters without impacting each other
  • Fully automatable via a REST API, with no impact on GUI users.
  • Robust and reliable delivery of traffic to security and performance management tools.
  • Unlimited bandwidth, since dynamic filters are implemented in the core of the ASIC and not on the network or tool port.
  • Significantly less skill required to manage filters, no need for a PhD.
  • Low training investment, managing the visibility fabric is intuitive.
  • More time to focus on Security Resilience and Application Performance

Additional Resources:

Ixia Visibility Architecture

Thanks to Ixia for the article. 

Flow-Based Network Intelligence You Can Depend On

NetFlow Auditor is a complete and flexible toolkit for flow based network analysis, which includes real-time analysis, long-term trending and base-lining.

NetFlow Auditor uses NetFlow based analysis as opposed to the traditional network analysis products which focus on the health of network gateway devices with basic information and overview trends.

Netflow analysis looks at end-to-end performance using a technological approach that is largely independent of the underlying network infrastructure thus providing greater visibility of the IP environment as a whole.

NetFlow Auditor provides an entire team in a box and is focussed on delivering four main value propositions for reporting for IP based networks:

NetFlow Auditor Network Performance

Network Performance

NetFlow Auditor Network Security

Network Secutiry

NetFlow Auditor Anomaly Detection

Network Intelligence

NetFlow Auditor Network Team in a Box

Network Accounting

Network Performance

Bandwidth management, bottleneck identification and alerting, resource and capacity planning, asset management, content management, quality of service

Network Security

Network data forensics and anomaly detection, e-security surveillance, network abuse, P2P discovery, access management, Compliance, track and trace and risk management

Network Intelligence

Network Anomaly Detection and Data metrics.

Network Accounting

Customer billing management for shared networks which translates to other costs, invoicing, bill substantiation, chargeback, 95th Percentile, total cost of ownership, forecasting, Information Technology ROI purchases substantiation.

How NetFlow Auditor Shines

Scalability – NetFlow Auditor can handle copious amounts of flows per second and therefore key data won’t be missed when pipes burst or when flows increases. Auditor can analyze large network cores, distribution and edge points. This includes point solutions or multi-collector hierarchies.

Granularity- NetFlow Auditor provides complete drill down tools to fully explore the data and to perform Comparative Base-lining in real time and over long term. This gives users the ability to see Network data in all perspectives.

Flexibility – NetFlow Auditor allows easy customization of every aspect of the system from tuning of data capture to producing templates and automated Reporting and Alerting thus decreasing the workload for engineers, management and customers.

Anomaly Detection – NetFlow Auditor’s ability to learn a baseline on any kind of data is unsurpassed. The longer it runs the smarter it becomes.

Root Cause Analysis – NetFlow Auditor’s drill filter and discovery tool allows real-time forensic and trending views, with threshold alerting and scheduled reporting.

QoS Analysis – NetFlow Auditor can help analyze VoIP impact, and Multicast and Separate traffic by Class of Service and by Location.

Key Issued Solved using Flow-Based Network Management

Absolute Visibility – As businesses use their data networks to deliver more applications and services, the monitoring and managing the network for problems performance can become a challenge. NetFlow Auditor real time monitoring and improve reaction times to solve network issues such as identifying and shutting down malicious traffic when it appears on the network.

Compliance and Risk – System relocations, Business and System Mergers.

Convergence – Organizations that are moving disparate networks to a converged platform in an effort to streamline costs and increase productivity can use NetFlow Auditor to understand its impact on security and to address security blind spots in the converged network

Proactive Network Management – NetFlow Auditor can be used as a tool by Risk Management to reduce risk and improve incident management by comparing normal network behaviours and performance at different times of the day to compare the current problems with a baseline.

Customers include Internet Service Providers, Banks, Education, Healthcare and Utilities such as:

  • Bell Aliant
  • KDDI
  • BroadRiver
  • First Digital
  • NSW Department of Education and Training
  • IBM
  • StreamtheWorld
  • Desjardins Bank
  • Commonwealth Bank of Australia
  • Miami Dade County
  • Miami Herald
  • Sheridan College
  • Mitsui Sumitomo
  • Caprock Energy
  • Zesco Electricity
  • Self Regional Healthcare

Thanks to NetFlow Auditor for the article.

Avoid the VM Blackout: A Guide to Effective Server Monitoring

When it comes to IT services, business value and user satisfaction are both dependent upon the server, network, and applications all working together seamlessly.

Failure to adequately monitor each of these and their interactions, means that you could be flying blind – susceptible to degraded service levels.

While application and network monitoring receive a lot of the attention, it is important to also understand what’s going on with the server.

Virtualization changes the face of service delivery

The environment in which modern services run is complex. Superficially, it appears as though we’ve traveled back to the 1960s, with data centers again appearing like big monolithic constructs (whether cloud or internally hosted) with highly-virtualized server farms connecting through large core networks.

The emergence of virtualized clients (with most computing done remotely) takes the analogy a step further and makes it feel as if we are on the set of “Mad Men” with the old dumb terminals connected to the mainframe.

But that may be where the analogy ends. Today’s IT service delivery is almost never performed in a homogeneous vendor setting—from a hardware or software perspective. Likewise, the diversity of complex multi-tier applications and methods by which they are accessed continues to proliferate.

To learn more, download the white paper.

Avoid the VM Blackout: A Guide to Effective Server Monitoring

Thanks to Network Instruments for the article.

Ixia Study Finds That Hidden Dangers Remain within Enterprise Network Virtualization Implementations

Ixia (Nasdaq: XXIA), a leading provider of application performance and security resilience solutions, announced global survey results demonstrating that while most companies believe virtualization technology is a strategic priority, there are clear risks that need to be addressed. Ixia surveyed more than 430 targeted respondents in South and North America (50 percent), APAC (26 percent) and EMEA (24 percent).

The accompanying report titled, The State of Virtualization for Visibility Architecture™ 2015 highlights key findings from the survey, including:

  • Virtualization technology could create an environment for hidden dangers within enterprise networks. When asked about top virtualization concerns, over one third of respondents said they were concerned with their ability (or lack thereof) to monitor the virtual environment. In addition, only 37 percent of the respondents noted they are monitoring their virtualized environment in the same manner as their physical environment. This demonstrates that there is insufficient monitoring of virtual environments. At the same time, over 2/3 of the respondents are using virtualization technology for their business-critical applications. Without proper visibility, IT is blind to any business-critical east-west traffic that is being passed between the virtual machines.
  • There are knowledge gaps regarding the use of visibility technology in virtual environments. Approximately half of the respondents were unfamiliar with common virtualization monitoring technology – such as virtual tap and network packet brokers. This finding indicates an awareness gap about the technology itself and its ability to alleviate concerns around security, performance and compliance issues. Additionally, less than 25 percent have a central group responsible for collecting and monitoring data, which leads to a higher probability for a lack of consistent monitoring and can pose a huge potential for improper monitoring.
  • Virtualization technology adoption is likely to continue at its current pace for the next two years. Almost 75 percent of businesses are using virtualization technology in their production environment, and 65 percent intend to increase their use of virtualization technology in the next two years
  • Visibility and monitoring adoption is likely to continue growing at a consistent pace. The survey found that a large majority (82 percent) agree that monitoring is important. While 31 percent of respondents indicated they plan on maintaining current levels of monitoring capabilities, nearly 38 percent of businesses plan to increase their monitoring capabilities over the next two years.

“Virtualization can bring companies incredible benefits – whether in the form of cost or time saved,” said Fred Kost, Vice President of Security Solutions Marketing, Ixia. “At Ixia, we recognize the importance of this technology transformation, but also understand the risks that are involved. With our solutions, we are able to give organizations the necessary visibility so they are able to deploy virtualization technology with confidence.”

Download the full research report here.

Ixia's The State of Virtualization for Visibility Achitectures 2015

Thanks to Ixia for the article.

Be Ready for SDN/ NFV with StableNet®

Software Defined Networking (SDN) and Network Functions Virtualization (NFV) are two terms that have garnered a great deal of attention in the Telco market over the last couple of years. However, before actually adopting SDN/NFV, several challenges have to be mastered. This article discusses those challenges and explains why StableNet® is the right solution to address them.

SDN and NFV are both very promising approaches. The main objectives are to increase the flexibility of the control and to reduce costs by moving from expensive special purpose hardware to common off-the-shelf devices. SDN enables the separation of the control plane and data plane, which results in better control plane programmability, flexibility, and much cheaper costs in the data plane. NFV is similar but differs in detail. This concept aims at removing network functions from inside the network and putting them into typically central places, such as datacenters.

Six things to think about before implementing SDN/NFV

The benefits of SDN and NFV seem evident. Both promise to increase flexibility and reduce cost. The idea of common standards seems to further ease the configuration and handling of an SDN or NFV infrastructure. However, our experience shows that with the decision to “go SDN or NFV” a lot of new challenges arise. Six of the major ones – far from a complete list – are addressed in the following:

1. Bootstrapping/”Underlay”- configuration:

How to get the SDN/NFV infrastructure setup before any SDN/NFV protocols can actually be used?

2. Smooth migration:

How to smoothly migrate from an existing environment while continuously assuring the management of the entire system consisting of SDN/NFV and legacy elements?

3. Configuration transparency and visualization:

How to assure that configurations via an abstracted northbound API are actually realized on the southbound API in the proper and desired way?

4. SLA monitoring and compliance:

How to guarantee that the improved applicationawareness expected from SDN and NFV really brings the expected benefits? How to objectively monitor the combined SDN/NFV and legacy network, its flows, services and corresponding KPIs? How to show that the expected benefits have been realized and quantify that to justify the SDN/NFV migration expenses?

5. Competing standards and proprietary solutions:

How to orchestrate different standardized northbound APIs as well as vendor-specific flavors of SDN and NFV?

6. Localization of failures:

How to locate failures and their root cause in a centralized infrastructure without any distributed intelligence?

Almost certainly, some or even all of these challenges are relevant to any SDN/NFV use case. Solutions need to be found before adopting SDN/NFV.

  • StableNet® SDN/NFV Portfolio – Get ready to go SDN/NFV StableNet® is a fully integrated 4 in 1 solution in a single product and data structure, which includes Configuration, Performance, and Fault Management, as well as Network and Service Discovery. By integrating SDN and NFV, StableNet® offers leverage the following benefits:
  • Orchestration of large multi-vendor SDN/NFV and legacy environments- StableNet® is equipped with a powerful and highly automated discovery engine. Besides its own enhanced network CMDB, it offers inventory integration with third party CMDBs. Furthermore, StableNet® supports over 125 different standardized and vendor-specific interfaces and protocols. Altogether, this leads to an ultra-scalable unified inventory for legacy and SDN/NFV environments.
  • KPI measurements and SLA assurance- The StableNet® Performance Module offers holistic service monitoring on both server and network levels. It thereby combines traditional monitoring approaches, such as NetFlow with new SDN and NFV monitoring approaches. A powerful script engine allows to configure sophisticated End-to-End monitoring scripts. The availability of cheap Plug & Play StableNet® Embedded Agents furthermore simplifies the distributed measurement of a service. Altogether, this gives the possibility to measure all the necessary KPIs of a service and to assure its SLA compliance.
  • Increased availability and mitigation of failures in mixed environments- The StableNet® Fault and Impact Modules with the SDN extension combines a device-based automated root cause analysis with a service-based impact analysis to provide service assurance and fulfillment.
  • Automated service provisioning, including SDN/NFV– StableNet® offers an ultra-scalable, automated change management system. An integration with SDN northbound interfaces adds the ability to configure SDN devices. Support of various standardized and vendorspecific virtualization solutions paves the way for NFV deployments. StableNet® also offers options to help keep track of changes done to the configuration or to check for policy violations and vulnerabilities.

StableNet® Service Workflow – Predestined for SDN/NFV The increasing IT complexity in today’s enterprises more and more demands for a holistic, aggregated view on the services in a network, including all involved entities, e.g. network components, servers and user devices.

The availability of this service view, including SDN/NFV components, facilitates different NMS tasks, such as SLA monitoring or NCCM.

The definition, rollout, monitoring, and analysis of services is an integral part of the Service Workflow offered by StableNet®. This workflow, see Figure 1, is also predestined to ease the management of SDN and NFV infrastructures.

Figure 1: StableNet® Service WorkFlow – predestined for SDN/NFV management

Be Ready for SDN/ NFV with StableNet®

Trend towards “Virtualize Everything”

Besides SDN and NFV adoption trending upwards, there is also an emerging trend that stipulates “virtualize everything”. Virtualizing servers, software installations, network functions, and even the network management system itself leads to the largest economies of scale and maximum cost reductions.

StableNet® is fully ready to be deployed in virtualized environments or as a cloud service. An excerpt of the StableNet® Management Portfolio is shown in Figure 2.

Figure 2: StableNet® Management Portfolio – Excerpt

Be Ready for SDN/ NFV with StableNet®

Thanks to InterComms for the article.

Solving 3 Key Network Security Challenges

With high profile attacks from 2014 still fresh on the minds of IT professionals and almost half of companies being victims of an attack during the last year, it’s not surprising that security teams are seeking additional resources to augment defenses and investigate attacks.

As IT resources shift to security, network teams are finding new roles in the battle to protect network data. To be an effective asset in the battle, it’s critical to understand the involvement and roles of network professionals in security as well as the 3 greatest challenges they face.

Assisting the Security Team

The recently released State of the Network Global Study asked 322 network professionals about their emerging roles in network security. Eighty-five percent of respondents indicated that their organization’s network team was involved in handling security. Not only have network teams spent considerable time managing security issues but the amount of time has also increased over the past year:

  • One in four spends more than 10 hours per week on security
  • Almost 70 percent indicated time spent on security has increased

Solving 3 Key Network Security Challenges

Roles in Defending the Network

From the number of responses above 50 percent, the majority of network teams are involved with many security-related tasks. The top two roles for respondents – implementing preventative measures (65 percent) and investigating security breaches (58 percent) – mean they are working closely with security teams on handling threats both proactively and after-the-fact.

Solving 3 Key Network Security Challenges

3 Key Security Challenges

Half of respondents indicated the greatest security challenge was an inability to correlate security and network performance. This was followed closely by an inability to replay anomalous security issues (44 percent) and a lack of understanding to diagnose security issues (41 percent).

Solving 3 Key Network Security Challenges

The Packet Capture Solution

These three challenges point to an inability of the network team to gain context to quickly and accurately diagnose security issues. The solution lies in the packets.

  • Correlating Network and Security Issues

Within performance management solutions like Observer Platform, utilize baselining and behavior analysis to identify anomalous client, server, or network activities. Additionally, viewing top talkers and bandwidth utilization reports, can identify whether clients or servers are generating unexpectedly high amounts of traffic indicative of a compromised resource.

  • Replaying Issues for Context

The inability to replay and diagnose security issues points to long-term packet capture being an under-utilized resource in security investigations. Replaying captured events via retrospective analysis appliances like GigaStor provides full context to identify compromised resources, exploits utilized, and occurrences of data theft.

As network teams are called upon to assist in security investigations, effective use of packet analysis is critical for quick and accurate investigation and remediation. Learn from cyber forensics investigators how to effectively work with security teams on threat prevention, investigations, and cleanup efforts at the How to Catch a Hacker Webinar. Our experts will uncover exploits and share top security strategies for network teams.

Thanks to Network Instruments for the article.

Manage your SDN Network with StableNet®

SDN – A Promising Approach for Next Generation Networks

Recently, Software Defined Networking (SDN) has become a very popular term in the area of communication networks. The key idea of SDN is to introduce a separation of the control plane and the data plane of a communication network. The control plane is removed from the normal network elements into typically centralized control components. The normal elements can be replaced by simpler and therefore cheaper off-the-shelf devices that are only taking care of the data plane, i.e. forwarding traffic according to rules introduced by the control unit.

SDN is expected to bring several benefits, such as reduced investment costs due to cheaper network elements, and a better programmability due to a centralized control unit and standardized vendor-independent interfaces. In particular, SDN is also one of the key enablers to realize network virtualization approaches which enable companies to provide application aware networks and simplify cloud network setups.

There are various SDN use cases and application areas that mostly tend to benefit from the increased flexibility and dynamicity offered by SDN. The application areas reach from resource management in the access area with different access technologies, over datacenters where flexible and dynamic cloud and network orchestration are more and more integrated, to the business area where distributed services can be realized more flexibly over dedicated lines realized by SDN. Each SDN use case is, however, as individual as the particular company. A unified OSS solution supporting SDN, as offered with Infosim® StableNet®, should therefore be an integral part of any setup.

SDN Challenges – 6 things to think about before you go SDN

The benefits of SDN seem evident. It is a very promising approach to increase flexibility and reduce cost. The idea of a common standard further seems to ease the configuration and handling of an SDN network. However, our experience shows that with the decision to “go SDN” a lot of new challenges arise. Six major ones of these challenges – by far no complete list – are addressed in the following.

Bootstrapping, Configuration and Change Management

SDN aims at a centralization of the network control plane. Given that an SDN network is readily setup, a central controller can adequately manage the different devices and the traffic on the data plane. That is, however, exactly one of the challenges to solve. How to get the SDN network to be setup before any SDN protocols can actually be used? How to assign the different SDN devices to their controllers? How to configure backup controllers in case of outages, etc.? The common SDN protocols are not adequate for these tasks but focus on the traffic control of a ready setup network. Thus, to be ready to “go SDN” additional solutions are required.

Smooth migration from legacy to SDN

The previously mentioned phenomenon of a need for configuration and change management is furthermore exacerbated by the coexistence of SDN and non-SDN devices. From our experience in the Telco industry, it is not possible to start from scratch and move your network to an SDN solution. The challenge is rather to smoothly migrate an existing environment while continuously assuring the management of the entire system consisting of SDN and non-SDN elements. Thus, legacy support is an integral part of SDN support.

Configuration transparency and visualization

By separating control plane and data plane, SDN splits the configuration into two different levels. When sending commands to the SDN network, normally you never address any device directly but this “south bound” communication is totally taken care of by the controllers. All control steps are conducted using the “north bound” API(s). This approach on the one side simplifies the configuration process, on the other side leads to a loss of transparency. SDN itself does not offer any neutral/ objective view on the network if the configuration sent via the north bound API actually was sent to the south bound API in the proper and desired way. However, such a visualization, e.g., as overlay networks or on a per flow base, is an important requirement to assure the correctness and transparency of any setup.

SLA monitoring and compliance

The requirements to SDN mentioned earlier even go one step further. Assuring the correctness and transparency of the setup as mentioned before only guarantees that path layouts, flow rules, etc. are setup in a way as desired during the configuration process. To assure the effectivity of resource management and traffic engineering actions and thus the satisfaction of the customers using the infrastructure, however, more than just the correctness of the setup is needed. SLAs have to be met to assure that the users really get what they expect and what they pay for. The term SDN often goes along with the notion of application-aware networks. However, SDN itself cannot provide any guarantee that this application-awareness really brings the expected benefits. Thus, a possibility for an objective monitoring of the network, its flows, services and their corresponding KPIs is necessary.

Handling of competing standards and proprietary solutions

One main expectation to SDN is that a common standard will remove the necessity to control any proprietary devices. However, recent developments show that first, the different standardization efforts cannot really agree on a single controller and thus a single north bound API. Furthermore, many popular hardware vendors even offer their proprietary flavor of SDN. To cope with these different solutions, an adequate mediation layer is needed.

Localization of failures without any “distributed intelligence”

In a traditional network with decentralized control plane, the localization of failed components can be done as a part of the normal distributed protocols. Since devices are in continuous contact anyway, failure information is spread in the network and the actual location of an outage can thus be identified. In an SDN environment, what has been a matter of course suddenly cannot be relied on anymore. By design, devices normally only talk to the controller and only send requests if new instructions are needed. Devices never talk to any other devices and might not even have such capabilities. Therefore, on the one hand a device will in general not recognize if any adjacent link is down, and on the other hand in particular, will not spread such information in the network. Therefore, new possibilities have to be found to recognize and locate failures.

To learn more, download the white paper

Manage your SDN Network with StableNet®