Eight Steps to take when conducting your first threat hunt

Unlike traditional, reactive approaches to detection, hunting is proactive. With hunting, security professionals don’t wait to take action until they’ve received a security alert or, even worse, suffer a data breach. Instead, hunting entails looking for opponents who are already in your environment.

Hunting leads to discovering undesirable activity in your environment and using this information to improve your security posture. These discoveries happen on the security team’s terms, not the attacker’s. Rather than launching an investigation after receiving an alert, security teams can hunt for threats when their environment is calm instead of in the midst of the chaos that follows after a breach is detected.

To help security professionals better facilitate threat hunting, here are step-by-step instructions on how to conduct a hunt.

1. Internal vs. outsourced 

If you decide to conduct a threat hunting exercise, you first need to decide whether to use your internal security team or outsource it to an external threat hunting service provider. Some organization have skilled security talent that can lead a threat hunt session. To enable a proper exercise, they should solely work on the hunting assignment for the span of the operation, equipping them to solely focus on this task.

When a security team lacks the time and resources hunting requires, they should consider hiring an external hunting team to handle this task.

2. Start with proper planning

Whether using an internal or external vendor, the best hunting engagements start with proper planning. Putting together a process for how to conduct the hunt yields the most value. Treating hunting as an ad hoc activity won’t produce effective results. Proper planning can assure that the hunt will not interfere with an organization’s daily work routines.

3. Select a topic to examine 

Next, security teams need a security topic to examine. The aim should be to either confirm or deny that a certain activity is happening in their environment. For instance, security teams may want to see if they are targeted by advanced threats, using tools like fileless malware, to evade the organization’s current security setup.

4. Develop and test a hypothesis

The analysts then establish a hypothesis by determining the outcomes they expect from the hunt. In the fileless malware example, the purpose of the hunt is to find hackers who are carrying out attacks by using tools like PowerShell and WMI.

Collecting every PowerShell processes in the environment would overwhelm the analysts with data and prevent them from finding any meaningful information. They need to develop a smart approach to testing the hypothesis without reviewing each and every event.

Let’s say the analysts know that only a few desktop and server administrators use PowerShell for their daily operations. Since the scripting language isn’t widely used throughout the company, the analysts executing the hunt can assume to only see limited use of PowerShell. Extensive PowerShell use may indicate malicious activity. One possible approach to testing the hunt’s hypothesis would be to measure the level of PowerShell use as an indicator of potentially malicious activity.

5. Collect information

To review PowerShell activity, analysts would need network information, which can be obtained by reviewing network logs, and endpoint data, which is found in database logs, server logs or Windows event logs.

To figure out what PowerShell use look like in a specific environment, the analyst will collect data including process names, command line files, DNS queries, destination IP addresses and digital signatures. This information will allow the hunting team to build a picture of relationships across different data types and look for connections.

6. Organize the data

Once that data has been compiled, analysts need to determine what tools they’re going to use to organize and analyze this information. Options include the reporting tools in a SIEM, purchasing analytical tools or even using Excel to create pivot tables and sort data. With the data organized, analysts should be able to pick out trends in their environment. In the example reviewing a company’s PowerShell use, they could convert event logs into CSV files and uploaded them to an endpoint analytics tool.

7. Automate routine tasks 

Discussions about automation may turn off some security analysts get turn off. However, automating some tasks is key for hunting team’s’ success. There are some repetitive tasks that analysts will want to automate, and some queries that are better searched and analyzed by automated tools.

Automation spares analysts from the tedious task of manually querying the reams of network and endpoint data they’ve amassed. For example, analysts may want to consider automating the search for tools that use DGAs (domain generation algorithms) to hide their command and control communication. While an analyst could manually dig through DNS logs and build data stacks, this process is time consuming and frequently leads to errors.

8. Get your question answered and plan a course of action

Analyst will should now have enough information to answer their hypothesis, know what’s happening in their environment and take action. If a breach is detected, the incident response team should take over and remediate the issue. If any vulnerabilities are found, the security team should resolve them.

Continuing with the PowerShell example, let’s assume that malicious PowerShell activity was detected. In addition to alerting the incident response team, security teams or IT administrators should the Group Policy Object settings in Windows to prevent PowerShell scripts from executing.

Thanks to Cybereason, and author Sarah Maloney for this article

Infosim: Go with the flow – choose the right tool though!

NetFlow is a handy tool in the daily work of Network Admins and Analysts. It can be used to measure traffic in networks from an End-to-End perspective, and allows the filtering by several types of data:

  • ​Time
  • Source/destination IP
  • Source/destination port numbers (at least for UDP and TCP)
  • Ingress interface SNMP ifIndex TOS information
  • AS numbers
  • TCP flags
  • Protocol type

How does it work?

NetFlow information is exposed by compatible routers or switches. These can be configured to send their NetFlow data in a well-defined format to a dedicated collector that is responsible for storing the data. A reporting engine can then access the data storage and perform analysis, create a statistic, plot charts for the end-user, etc. But, when drilling down into the details, it is unfortunately not as easy as it sounds.

Flow fragmentation

Originally developed by Cisco, NetFlow has developed into an open standard (https://tools.ietf.org/html/rfc3954), but has also spawned other types of Flow implementations over time, like sFlow, cFlow, jFlow, IPFIX, only to name a few. Some of them are compatible with each other, others are not – like NetFlow and sFlow. Furthermore, also the orginal NetFlow specifications have experienced multiple revisions, and in the wild, there are different versions. Maintaining support for all those versions is not trivial.

Data storage

As NetFlow is a passive monitoring tool, you cannot simply query the Flow emitters. Quite the contrary, data is sent once – via UDP. What’s worse is that the data volume, which might be considerably high, is likely to be sent in bursts. That means the Flow collector must be able to handle all the incoming packets with sufficient speed. If there are packet drops or I/O problems, the data is lost. To perform in a Telco-grade network, the monitoring solution must be well-designed and decouple data collection from necessary data preprocessing and storage.

Correlating the data

Once the data is collected, you would want to make use of it via reports, for example. As you likely have multiple Flow emitters in your network, it is also likely that you have to handle multiple Flow versions. Therefore, it is crucial to preprocess and transform the Flows into a unified data format to provide version-spanning reporting. If you have a large network, you will need multiple Flow collectors to handle the vast amount of data. In order to provide also collector-spanning reporting, you will eventually need a central database where it all comes together.

However, bringing it all together is often not enough. Flows only contain “raw” information about source and target: IP addresses, ports, and protocol information. Most of this only becomes valuable in a bigger scope – when you correlate the IP addresses to actual devices and their related services and topology. This enables you to not only track top talkers in your network, but also keep an eye on the impact, which should be done with a method that incorporates fault management.

Integration

Most likely, there are multiple monitoring tools in place. Maybe that is because no tool has covered it all yet, or because of different departments and different preferences of the people in charge. As such, NetFlow tools will presumably never be isolated, but always part of a bigger picture. That’s why it is important to have a rich set of northbound interfaces. A relay functionality can be a big help if certain Flows should be also redirected to legacy systems due to some existing business process, or just temporarily while the new solution is evaluated without touching the daily business of the NOC.

Another integration aspect is the support for multi-tenancy. Service providers often offer statistics and other report data to their customers to give them an overview of their purchased services’ performance. As Flow packets do not carry any customer information, correlation between Flows and customers is not a trivial task.

How to choose the right tool?

​Over the years, many companies and people have realized the benefits of NetFlow. As a result, you now have dozens of free and commercial tools to choose from. As you will have noticed, a good NetFlow solution faces lots of requirements, and it is hard to cover them all.

Many free solutions do not have many contributors and consequently have to focus on different parts of the NetFlow eco system – which is often about collecting, storing, and reporting. Whereas coverage of the different Flow protocols is often good, there is still room for improvement especially on the integration side. It is also the case that those free tools often do not scale well enough to be used in a Telco environment.

Besides community-driven solutions, there are also some free professional solutions developed by companies. Most of them have a business model that allows free usage of the basic functionalities, but limits the integration, correlation, or storage functionalities. To unlock those features, you have to buy the paid version, which is reasonable, as it is made by a company that needs to pay its employees.

The unified approach

Eventually, it is likely that you will end up using a proprietary solution for your NetFlow requirements if you want to implement a solution in an advanced environment and make use of all NetFlow has to offer. That is, in a nutshell, End-to-End visibility of traffic in your network, which can only be achieved if your NetFlow tool can integrate very well in your inventory, performance, and fault management setup. As integration costs can be considerably high, a unified monitoring tool, even if it only provides basic Flow analysis and reporting capabilities, might provide the best ROI in this scenario.

Whatever road you take, make sure to keep the big picture in mind and try not to waste time implementing a solution that leads to a dead end. More information is available here on a Netflow monitoring technology solution.

Thanks to Infosim for this article.

Ixia Has Your Secret Weapon Against SSL Threats

It has finally happened: thanks to advances in encryption, legacy security and monitoring tools are now useless when it comes to SSL. Read this white paper from Ixia, to learn how this negatively impacts visibility into network applications, such as e-mail, e-commerce, online banking, and data storage. Or even worse, how advanced malware increasingly uses SSL sessions to hide, confident that security tools will neither inspect nor block its traffic.

  • ​Consider the following challenges:
  • Visibility into ephemeral key traffic
  • Coping with CPU-intensive encryption and decryption tasks
  • Chaining and handling multiple security tools
  • Meeting the demands of regulatory compliance

The very technology that made our applications secure is now a significant threat vector. The good news is, there is an effective solution for all of these problems. Learn how to eliminate SSL related threats in this white paper.

Thanks to Ixia for this article

Viavi’s On-Demand Application Dependency Mapping Central to Latest Observer Update

New Observer Apex offers faster loading speeds, connection dynamics functionality for packet visibility, on-demand application dependency mapping (ADM), improved widget editor for faster insights, VoIP service-level agreement assurance based on threshold monitoring, faster alarms, and more.

On-Demand ADM

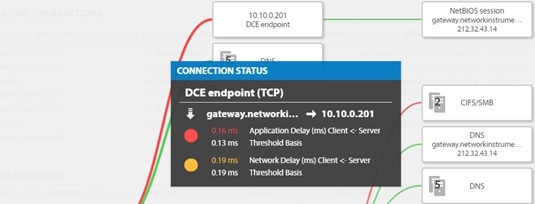
On-demand ADM offers fast discovery of application interdependencies, building maps that visualize these complex relationships with simple clarity and can be launched from any widget containing an IP address, IP pair, or client/server IP. The functionality auto-determines worst connections on application and network delay threshold deviations and sorts all connections by status, indicating whether that status is critical, marginal, or acceptable.

With the appropriate SPAN and TAP network feeds, Apex can produce this detailed application dependency map in seconds, potentially eliminating hours of war room time by identifying the application tier and domain on-demand. This functionality helps to enable true organizational collaboration.

Connection Dynamics

Apex provides for total visibility into every network transaction from your browser to anywhere in the world with an Internet connection. Begin with a dashboard view, drill down in just a few steps within any Apex widget containing an IP pair or an application and get a simple-to-visualize ladder diagram of every packet and associated key operational metric tied to the conversation including network, client, and server delay along with total application fulfillment time.

Observer Analyzer/GigaStor

Users will also enjoy a redesigned and streamlined Observer Analyzer interface featuring a Windows ribbon bar and a modern application look-and-feel. Eliminate complexity and troubleshoot network issues faster with the latest Observer upgrades.

Eliminate complexity and troubleshoot network issues faster with the Observer Platform.

Learn more Observer Apex, and Viavi and their other available products.

NMSaaS’ The Importance of Network Performance Monitoring

In 2017, any drop in your network’s performance will affect your enterprise’s overall productivity. Ensuring the optimal performance of your network, in turn, requires sophisticated network performance monitoring. Through exceptional reporting and optimization, a high-quality network performance monitoring service can ensure that every aspect of your network is always performing at its best. Here we take a close look at how network performance monitoring works, and the key benefits it provides. 

​How it works

Getting outside the system

In order to engage in effective network performance monitoring, the service that is monitoring the network must reside outside the network itself.

This is obvious in the case of monitoring a network for system failure: if the monitoring software resides within the network that fails, then it cannot report the failure.

However, keeping the monitoring service outside the network is just as important when it comes to monitoring performance. Otherwise, the service will be monitoring its own performance as yet another part of the system, which will compromise the accuracy of its performance data.

Monitoring key metrics

A high-quality network performance monitoring service monitors all of the devices that make up your company’s network, as well as all of the applications that depend on them.

One of the key metrics the monitoring service will track is your network’s response time. In the context of a computer network, response time is a measure of the time it takes for various components and applications within your company’s network to respond. For example, suppose you have an Enterprise Resource Planning (ERP) system installed on your network. Further, suppose an employee clicks on a tab in the ERP’s main dashboard and experiences a long delay. This indicates a poor response time, which is often due to a network with sub-optimal performance.

Alerting and reporting

Depending on your company’s preferences, if there is a significant drop in a key measure of network performance, the network monitoring service will generally alert the system administrator. Yet most high-quality monitoring services also provide network optimization; real-time performance data; and detailed periodic reports calling out any weak points the administrator needs to address to preserve and enhance your network’s overall health and performance. 

The key benefits

A competitive edge

Suppose that you and your top competitor both have precisely the same enterprise network hardware, software, configuration and bandwidth. However, your network has sophisticated performance monitoring in place to keep it in optimal health, and your competitor’s network does not.

Consequently, your staff is sailing through the same network-dependent tasks that your competitor’s staff is slogging through. In this case, you have a significant edge over your top competitor in terms of productivity. On the other hand, if the roles are reversed, and your competitor is the one with high-quality network performance monitoring in place, then they are the one with the edge. Either way, it’s clear that network performance monitoring is a significant contributor to enterprise productivity.

Time and cost savings

Even a few seconds of delay in performing common tasks and opening up key pages within a networked enterprise application can eventually result in hundred of hours of lost time each year. Performance monitoring can save you that time. It can also help you optimize your server and other network components to help prolong their expected lifespans. On the other hand, hardware with consistent performance problems is under strain and may fail unexpectedly.

Consistency

Having a network with consistent optimal performance significantly improves productivity and morale. On the other hand, a network with inconsistent performance will lead to unpredictable work conditions and inconsistent output. For example, suppose your staff is working on an urgent project with a tight deadline. If the network’s performance is inconsistent, they will have no way of predicting whether they can reasonably meet the deadline or not. For this reason, a network with inconsistent performance can be as problematic as a network with frequent downtime.

Effective troubleshooting

There are a large number of subtle factors and gradually unfolding events that can degrade the performance of your network and hurt your company’s productivity without your being directly aware of it. One of the most common is a gradual increase in network usage over time without any improvements to the network itself to accommodate the increase. For example, a company might expand its staff without adding servers or increasing network bandwidth. As the new team members ramp up their usage, network performance begins to decline.

In other cases, an enterprise application connected to the network may suffer from sub-optimal performance that staff believe is due to the network, when in fact it’s an enterprise software issue. In all of these cases, a high-quality network performance monitoring service can summon the data to quickly troubleshoot the situation. If usage has gradually increased without any network improvements to support the increase, the monitoring service’s data can identify the need for improvements. If an enterprise application is exhibiting long response times, the monitoring service can identify whether the source of the problem resides in the network or the enterprise software itself. This capacity to quickly and effectively troubleshoot network-related performance problems can save time and heartache.

Moreover, performance monitoring can also serve as a preventative measure by recognizing and troubleshooting performance problems before they become system failures. For example, by identifying a network component that is not performing optimally and that may soon fail, a high-quality performance monitoring service can help prevent the system failure from occurring. 

Getting started with network performance monitoring

Network performance monitoring keeps a close eye on key indicators of your network’s health. Additionally, a high-quality external monitoring service oversees your network from the outside to provide reliable, real-time performance-related reporting, alerting and optimization.

There are several key benefits of network performance monitoring for enterprises: the monitoring service helps your network-dependent applications and tasks perform at their optimal speed, giving you an edge on the competition; it reduces network response times and helps prolong hardware lifespans, saving you time and money; it provides performance consistency, giving you a network you can count on under time-sensitive deadlines; and it greatly accelerates the network troubleshooting process, giving you the freedom to focus on your business and not your network. Get started with NMSaaS here.

Thanks to NMSaaS and author John Olson for this article

Managing Phantom Devices on Your Network

{jcomments on}

Detecting Phantom Devices on Your NetworkWatch the Video - InfoSim

So you run a network discovery and you notice devices that you are not familiar with. A phantom device is a device that is unmanaged that should be monitored by your Network Management System (NMS)

It seems these devices show up even though you have processes in place to prevent this type of behavior. These could be devices connected to the wrong network, printers, BYOD etc. A phantom device is invisible to you so you are unaware of the device, opening a vulnerability, missing patches, Misconfigurations etc.

How to detect and integrate phantom devices

The first step is to find these devices so you know that they exist and track them. Once you find the device you need to extract device information and understand how they are integrated into your network. The detection process cannot interfere with your daily business; you don’t want to add any unnecessary load to the network and false positives need to be avoided.

Once the phantom devices have been discovered you need to set up a process to incorporate them into your Network Management System (NMS) or remove them from the network

InfoSim SableNet

Has the ability to help you in this process by using the automated discovery engine. This allows you to tag and then reporting on phantom devices. You can then see how they are connected to the network and using SNMP and the NCCM module you can then manage or remove these devices from your Network


3 Key Differences Between NetFlow and Packet Capture Performance Monitoring

The increasing density, complexity and expanse of modern networking environments have fueled the ongoing debate around which network analysis and monitoring tools serve the needs of the modern engineer best – placing Packet Capture and NetFlow Analysis at center-stage of the conversation. Granted, both can be extremely valuable tools in ongoing efforts to maintain and optimize complex environments, but as an engineer, I tend to focus on solutions that give me the insights I need without too much cost on my resources, while complementing my team’s ability to maintain and optimize the environments we support.

So with this in mind, let’s take a look at how NetFlow, in the context of the highly-dense networks we find today, delivers three key requirements network teams rely on for reliable end-to-end performance monitoring of their environments.

A NetFlow deployment won’t drain your resources

Packet Capture, however rich in network metrics, requires sniffing devices and agents throughout the network, which invariably require some level of maintenance during their lifespan. In addition, the amount of space required to store and analyze packet data makes it an inefficient an inelegant method of monitoring or forensic analysis. Combine this with the levels of complexity networks can reach today, and overall cost and maintenance associated with packet sniffers can quickly become unfeasible. In the case of NetFlow, its wide vendor support across virtually the entire networking landscape makes almost every switch, router or firewall a NetFlow “ready” device. Devices’ built-in readiness to capture and export data-rich metrics makes it easy for engineers to deploy and utilize . Also, thanks to its popularity, NetFlow analyzers of varying feature-sets are available for network operations center (NOC) teams to gain full advantage of data-rich packet flows.

Striking the balance between detail and context

Considering how network-dependent and widespread applications have become in recent years, NetFlow’s ability to provide WAN-wide metrics in near real-time makes it a suitable troubleshooting companion for engineers. And with version 9 of NetFlow extending the wealth of information it collects via a template-based collection scheme, it strikes the balance between detail and high-level insight without placing too much demand on networking hardware – which is something that can’t be said for Packet Capture. Packet Capture tools, however, do what they do best, which is Deep Packet Inspection (DPI), which allows for the identification of aspects in the traffic hidden in the past to Netflow analyzers. But Netflow’s constant evolution alongside the networking landscape is seeing it used as a complement to solutions such as Cisco’s NBAR and other DPI solutions who have recognized that all they need to do is use flexible Netflow tools to reveal details at the packet level.

NetFlow places your environment in greater context

Context is a chief area where NetFlow beats out Packet Capture since it allows engineers to quickly locate root causes relating to performance by providing a more situational view of the environment, its data-flows, bottleneck-prone segments, application behavior, device sessions and so on. We could argue that packet sniffing is able to provide much of this information too, but it doesn’t give engineers the broader context around the information it presents, thus hamstringing IT teams from detecting performance anomalies that could be subscribed to a number of factors such as untimely system-wide application or operating system updates or a cross-link backup application pulling loads of data across the WAN during operational hours.

So does NetFlow make Packet Capture obsolete

The short answer is, no. In fact, Packet Capture, when properly coupled with NetFlow, can make a very elegant solution. For example, using NetFlow to identify an attack profile or illicit traffic and then analyzing corresponding raw packets becomes an attractive solution. However, NetFlow strikes that perfect balance between detail and context and gives NOCs intelligent insights that reveals broader factors that can influence your network’s ability to perform. Gartner’s assertion that a balance of 80% NetFlow monitoring  coupled with 20% Packet Capture as the perfect combination of performance monitoring attests to NetFlow’s growing prominence as the monitoring tool of choice. And as it and its various iterations such sFlow, IPFIX and  others continue to expand the breadth of context it provides network engineers, that margin is set to increase in its favor as time.

Thank you to NetFlow Auditor for this post.

SDN/NFV – From Theory to Praxis with Infosim® StableNet®

InterComms talks to Marius Heuler, CTO Infosim®, about Infosim® StableNet® and the management and orchestration of SDN and NFV environments

infosim-1Marius Heuler has more than 15 years of experience in network management and optimization. As CTO and founding member of Infosim®, he is responsible for leading the Infosim® technical team in architecting, developing, and delivering StableNet®. He graduated from the University of Würzburg with a degree in Computer Science, holds several Cisco certifications, and has subject matter expert knowledge in various programming languages, databases and protocol standards. Prior to Infosim®, Marius held network management leadership positions and performed project work for Siemens, AOK Bavaria and Vodafone.

Q: The terms SDN and NFV recently have been on everybody’s lips. However, according to the critics, it is still uncertain how many telcos and enterprises use these technologies already. What is your point of view on this topic?

A: People tend to talk about technologies and ask for the support of a certain interface, service, or technology. Does your product support protocol X? Do you offer service Y? What about technology Z?

Experience shows that when looking closer at the actual demand, it is often not the particular technology, interface, or service people are looking for. What they really want is a solution for their particular case. That is why I would rather not expect anybody to start using SDN or NFV as an end in itself. People will start using these technologies once they see that it is the best (and most cost-efficient) way to relieve their pain points.

Andrew Lerner, one of the Gartner Blog Network members, recently gave a statement pointing in the exact same direction, saying that Gartner won’t publish an SDN Magic Quadrant, “because SDN and NFV aren’t markets. They are an architectural approach and a deployment option, respectively.“

infosim-chart-big

Q: You have been talking about use cases for SDN and NFV. A lot of these use cases are also being discussed in different standardization organizations or in research projects. What is Infosim®’s part in this?

A:There are indeed a lot of different use cases being discussed and as you mentioned a lot of different standardization and research activities are in progress. At the moment, Infosim® is committing to this area in various ways: We are a member of TM Forum and recently also joined the ETSI ISG NFV. Furthermore, we follow the development of different open source activities, such as the OpenDaylight project, ONOS, or OPNFV, just to name a few. Besides this, Infosim® is part of several national and international research projects in the area of SDN and NFV where we are working together with other subject matter experts and researchers from academia and industry. Topics cover among others operation and management of SDN and NFV environments as well as security aspects. Last but not least, Infosim® is also in contact with various hardware and software vendors regarding these topics. We thereby equally look on open source solutions as well as proprietary ones.


Q: Let us talk about solutions then: With StableNet® you are actually quite popular and successful in offering a unified network management solution. How do SDN and NFV influence the further development of your offering?

A: First of all, we are proud to be one of the leading manufacturers of automated Service Fulfillment and Service Assurance solutions. The EMAtm has rated our solution as the most definitive Value Leader in the EMAtm Radar for Enterprise Network Availability Monitoring Systems in 2014. We do not see ourselves as one of the next companies to develop and offer their own SDN controller or cloud computing solution. Our intent is rather to provide our well-known strength in unified network management for the SDN/NFV space as well. This includes topics like Service Assurance, Fault Management, Configuration, and Provisioning, Service Modelling, etc.


Q: Are there any particular SDN controller or cloud computing solutions you can integrate with?

A: There is a wide range of different SDN controllers and cloud computing solutions that are currently of general interest. In its current SDN controller report the SDxcentral gave an overview and comparison of the most common open source and proprietary SDN controllers. None of these controllers can be named as a definite leader. Equally regarding the NFV area, the recent EMAtm report on Open Cloud Management and Orchestration showed that besides the commonly known OpenStack there are also many other cloud computing solutions that enterprises are looking at and think of working with.

These developments remind me of something that, with my experience in network management, I have known for over a decade now. Also when looking at legacy environments there have always been competing standards. Despite years of standardization activities of various parties, often none of the competing standards became the sole winner and rendered all other interfaces or technologies obsolete. In fact, there is rather a broad range of various technologies and interfaces to be supported by a management system.

This is one of the strengths that we offer with StableNet®. We currently support over 125 different standardized and vendor-specific interfaces and protocols in one unified network management system. Besides this, with generic interfaces both for monitoring and configuration purposes we can easily integrate with any structured data source by the simple creation of templates rather than the complicated development of new interfaces. This way, we can shift the main focus of our product and development activities to the actual management and orchestration rather than the adaption to new data sources.


Q: Could you provide some examples here?

A: We continuously work on the extension of StableNet® with innovative new features to further automate the business processes of our customers and to simplify their daily work. Starting from Version 7, we have extended our existing integration interfaces by a REST API to further ease the integration with third party products. With Dynamic Rule Generation, Distributed Syslog Portal, and Status Measurements we offer the newest technologies for an efficient alarming and fault management. Our StableNet® Embedded Agent (SNEA) allows for an ultra-scalable, distributed performance monitoring as well as for the management of IoT infrastructures. Being part of our unified network management solution, all these functionalities, including the ultra-scalable and vendor-agnostic configuration management, can equally be used in the context of SDN and NFV. A good way to keep up-to-date with our newest developments are our monthly Global Webinar Days. I would really recommend you to have a look at those.


Q: As a last question, since we have the unique chance to directly talk with the CTO of Infosim®, please let us be a little curious. What key novelties can people expect to come next from Infosim®?

A:There are of course many things that I could mention here, but the two areas that will probably have the most significant impact on management and orchestration are our new service catalog and the new tagging concept. With the service catalog the management is moved from a rather device- or server-based perspective to a holistic service-based view. This tackles both the monitoring and the configuration perspective and can significantly simplify and speed up common business processes. This is of course also related to our new tagging concept.

This new approach is a small revolution to the way that data can be handled for management and orchestration. We introduce the possibility for an unlimited number of customizable tags for each entity, let it be a device, an interface, or an entire service, and combine this with automated relations and inheritance of proprieties between the different entities. Furthermore, the entities can be grouped in an automated way according to arbitrary tag criteria. This significantly extends the functionality, usability, and also the visualization possibilities.

About Infosim® StableNet®
StableNet® is available in two versions: Telco (for Telecom Operators and ISPs) and Enterprise (for IT and Managed Service Providers).

StableNet® is a 3rd generation highly automated Network Management System. The key differentiation of StableNet® to other legacy type Operational Support Systems (OSS) is that StableNet® is a unified OSS system with three integrated functionalities that focus on Configuration, Fault, and Performance Management, with automated Root Cause Analysis (RCA). StableNet® can be deployed on a Multi-Tenant, Multi-Customer, or dedicated platform and can be operated in a highly dynamic flex-compute environment.

Thank you to InterComms for this post.

Infosim® Product Called StableNet® Chosen as Athenahealth Consolidates Network Performance Monitoring

Infosim®, the new leader in network performance management, today announced that it has been selected as the supplier of choice to consolidate the IT infrastructure performance monitoring capabilities at Athenahealth.

Following an extensive evaluation of the performance management market, the organization identified StableNet® as the only vendor capable of offering a single comprehensive view of the performance and capacity of its IT infrastructure in one unified solution, and with the highest levels of performance, scalability, and interoperability.

When introducing a performance monitoring solution, it is essential that it can be fully integrated with the existing infrastructure. Interoperability with existing monitoring systems was essential to the organization’s project, and will allow users to create the alerts and reports that they need to maintain current operations and plan for future capacity needs proactively.

Athenahealth’s network engineering team was looking for a tool that could monitor the health and performance of the company’s multivendor network and replace the majority of the point management tools being used. After narrowing the search to Infosim® StableNet®, the team conducted a successful proof of concept and elected to adopt the solution. StableNet® will replace more than a half-dozen point management tools and streamline network management practices.

Supporting Quotes:

Shamus McGillicuddy, Enterprise Management Associates Senior Analyst comments:
“Athenahealth, a provider of cloud-based healthcare software, will replace more than a half-dozen stand-alone network management tools with Infosim StableNet®. StableNet®, an enterprise network availability and performance management system, will help unify operations by providing customizable dashboards and network transparency to all key stakeholders in Athenahealth’s IT organization.”

Brian Lubelczyk, senior manager of data networks at Athenahealth comments:
“I discovered them at Cisco Live two years ago, and I was really impressed overall with how well they were able to hit everything we wanted to do on this project, from monitoring to capacity planning and transparency of the network. The more we used the product, the more we liked it. Even for simple bandwidth trending we were using three or four different tools.”

Link to full case study

ABOUT STABLENET®

StableNet® is available in two versions: Telco (for Telecom Operators and ISPs) and Enterprise (for IT and Managed Service Providers).

StableNet® Telco is a comprehensive unified management solution; offerings include: Quad-play, Mobile, High-speed Internet, VoIP (IPT, IPCC), IPTV across Carrier Ethernet, Metro Ethernet, MPLS, L2/L3 VPNs, Multi Customer VRFs, Cloud and FTTx environments. IPv4 and IPv6 are fully supported.

StableNet® Enterprise is an advanced, unified and scalable network management solution for true End-to-End management of medium to large scale mission-critical IT supported networks with enriched dashboards and detailed service-views focused on both Network & Application services.

Infosim®, the Infosim® logo and StableNet® are registered trademarks of Infosim® GmbH & Co. KG. All other trademarks or registered trademarks seen belong to their respective companies and are hereby acknowledged.

Thank you to Infosim for this post

Healthcare IT Reveals Network Rx

IT Heroes: A Prescription for Network Health

Each and every day, the bold men and women of IT risk it all to deliver critical applications and services. Their stories are unique. Their triumphs inspire. For the first time ever, the IT Heroes Series offers a revealing glimpse into the secrets and strategies that have won accolades for network teams around the world – and could do the same for you.

Initial Symptoms

Located in South West England, the Northern Devon National Health Service (NHS) trust serves a population of just under half a million. Operating across 1,300 square miles and providing vital IT services to a large district medical center and 17 community hospitals is serious business.

When the network slowed to a crawl, Network Technology Specialist, Peter Lee and his team were motivated to provide a fast diagnosis.

Tools of the Trade

Viavi Managing Healthcare IT

Since many life-saving tests and medical information are communicated via the healthcare network, it was critical for the team to get everything back on track fast. After receiving complaints about the “slow network,” Lee tested it out for himself. Like end users, he also experienced a series of timed-out sessions.

“I used Observer® GigaStor™ Retrospective Network Analysis to rewind the data, putting a filter on the machine. All that was coming back was SOPHOS,” says Lee, regarding the popular security software. “I widened the search to the subnet. It was an 11 minute capture with 25,000 hits on SOPHOSXL.net.”

Lee and his team had a hunch that the traffic from the SOPHOS application was abnormally high and hogging valuable network resources. But how could they prove it?

“I went back to a previous capture that I had run last February,” says Lee, referring to an ad hoc baseline established months before. “In some 20 minutes, the average was only 3,000 hits.”

With the previous network snapshot from GigaStor, the team was able to prove that the application traffic had drastically increased and was undoubtedly the cause of the slow network.

An Rx for a Network Fix

“We’ve got a call open with the SOPHOS senior team looking into this,” says Lee. “It works out to between 33 to 50 percent of all our DNS traffic is going out to SOPHOS. Without the GigaStor, I would have never known about the problem. It’s simple, it’s easy, and it’s fantastic.”

Find out how this IT Hero found the hardware issue that brought the network to its knees, and how his team uses Wireshark to troubleshoot on the go. Download the full Northern Devon NHS Case Study now.

Thanks to VIAVI for the article.