As we say goodbye to 2014 and review our network equipment plans for the new year, looking at replacement options is not enough.
We have to consider the currents that network technology flows in and where they are taking us.
Ignoring buying decisions and looking at the bigger picture provides an opportunity to assess what emerging companies are doing to redefine and redirect our network thinking, from the higher levels of standardisation, convergence and virtualisation down to how startups are meeting these challenges.
Here is what you should be aware of in 2015.
Standardisation
2015 will see the shifts in IT investments move towards standardised hardware and software products. The software and hardware standardisation efforts inherent in software-defined networks (SDN) and network function virtualisation (NFV) initiatives in the wide area network (WAN) will affect corporate network
Virtualisation
Existing datacentre hardware is being optimised in virtualised environments, and applications are being farmed out to public cloud providers, significantly changing the hardware equation.
Convergence
Hyperconverged infrastructure products combine compute, networking and storage resources to create all-in-one solutions. Hyperconverged appliances offer the scale-out architecture that fits the needs of most shared virtualised environments. To facilitate this, unified software packages have been adopted to converge networking functions previously allocated to dedicated hardware boxes such as WAN optimisers, packet shapers, application development controllers, application and network performance managers, load balancers and next-generation firewalls. This means storage and security are becoming intrinsic to networking topologies and, as such, will become embedded in networking hardware and software.
New challenges in 2015
The specific board-level demands to most enterprise network managers in 2015 will include:
- Handling 100% traffic growth with the same budget as in 2014.
- Recognising that much of that traffic growth, namely video, will be latency sensitive.
- Ensuring the growing bring your own device (BYOD) demand for connectivity is secure and delivers quality of service (QoS) to the customers.
- Minimising capital expenditure and go with industry-standard, bare-metal hardware to support SDN/NFV.
- Maximising operating expenses in software and hardware deals.
This translates into key concepts around aligning networks to support business processes, shifting more traffic to Ethernet, flexible cloud deployments and better integration of security and storage capabilities. Startups present interesting next-step products to dominant suppliers in all these categories.
Aligning Network Hardware To Business Processes
When the buyer focus shifts to commoditisation, this presents a serious challenge to profit margins for premium network hardware brands such as Cisco, HP and IBM. Conversely, it presents an opportunity for nimble startups in the network hardware business, as brand loyalty is eroded and the focus shifts to supporting horizontal business processes.
Startup hardware suppliers are adopting the same hyperconvergence logic as software suppliers by integrating complementary software functionality into their boxes to facilitate core business processes. The result is hardware with better integration levels, cheaper and simpler deployments and easier scale-out capacity than their software and brand-name competitors. Instead of outsourcing functions, these network hardware startups advocate on-premise enterprise networking strategies. The message certainly whets the appetite of investors.
They are not looking for startups selling Lego blocks for DIY constructions, but rather emerging suppliers with the integrated hardware and software to handle specific business needs with faster time to value than existing value propositions on the market. Market leader VMware, with its Evo: Rail concept, has aligned all parts of its vSphere and Virtual SAN (storage area network) ecosystem with seven hardware partners (Dell, EMC, Fujitsu, Inspur – China’s dominant cloud computing and service provider, NetOne – Japanese infrastructure optimiser, HP, and SuperMicro – the US application-optimised server, workstation, blade, storage and GPU systems provider).
Startup company Scale Computing, with its HC3 platforms, presents an interesting challenge to the Evo: Rail design, aimed at small and medium-sized enterprises (SMEs), and values simplicity and fast deployment. The three HC3 platforms scale from 40 to 400 virtual machines (VMs). Scale Computing uses a customised version of Red Hat’s KVM hypervisor and leverages a block-level storage architecture as opposed to Virtual SAN’s (VSAN) object-based approach. While KVM may not have as many features as vSphere, Scale Computing is banking on the simplicity of operation along with aggressive pricing compared to the competition, and uses a scale-out architecture that can handle four nodes as the infrastructure grows.
Large enterprises should look at the startup Simplivity and its OmniCube, a hyperconverged infrastructure that delivers the economies of scale of a cloud computing model while ensuring enterprise IT performance and resiliency for virtual workloads. OmniCube has a data architecture that addresses data efficiency and global management requirements in virtualised and cloud computing environments. Its single unified stack runs on standard and hyperconverged x86 building blocks, simplifying and lowering the cost of infrastructure. Deploying a network of two or more OmniCubes creates a global federation that facilitates efficient data movement, resource sharing and scalability.
Ethernet deployments
Ethernet adoption continues to expand and startups such as Arista provide important contributions with the 10-1000Gbps Ethernet switches that target cloud service providers with purpose-built hardware. Its EOS network operating system provides single-binary system images across all platforms, maximum system uptime, stateful fault repair, zero-touch provisioning, latency analysis and a fully accessible Linux shell. With native support for VMware virtualisation and hundreds of Linux applications integrated into hardware platforms, it is designed to meet the stringent power and cooling requirements of today’s most demanding datacentres.
Cloud in a box
In the SME market, SixSq’s Nuvlabox offers a turnkey private cloud in a box. The Mac Mini-sized box includes a complete infrastructure as a service (IaaS) framework, powered by StratusLab, and a platform as a service (PaaS) powered by Slipstream. The built-in Wi-Fi provides network connectivity. With the ability to run up to eight VMs, capacity constraints are solved by adding more boxes and managing them as a single unit. Nuvlabox comes with a library of standard apps and operating system images, including different flavours of Linux and Windows and allows secure remote monitoring and application deployment from a single dashboard. To bypass the capital expenditure objection, SixSq has shifted its business model towards business-to-business licensing, where service provider customers pay rental fees for the equipment and SixSq provides ongoing maintenance and call centre support.
Network Security
Increased use of IT adds value to corporate network transactions and attracts a lot of unwelcome attention. In 2015, we expect more hackers, script kiddies, professional thieves and state-sponsored advanced persistent threat (APT) attacks to target corporate networks. But there is still a lot of low-hanging fruit to gather, such as increased employee awareness of weak passwords and phishing exploits, faster remediation of security holes and better denial of service protection measures. There is also a need for better tools and procedures to protect the enterprise network and ensure these measures meet corporate governance, risk and compliance (GRC) requirements.
One supplier aiming to address these needs is Bromium, which combines a software client on any device with a central security server. Instead of using signatures, behaviours or heuristics to identify potential threats, its vSentry client creates hardware-isolated micro‑VMs for every network-related task, such as visiting a web page, downloading a document or opening an email attachment. All micro-VMs are separated from each other and from the trusted enterprise network. Thus, malware is contained in the hardware-isolated micro-VM. Bromium’s Live Attack Visualization and Analysis (Lava) server converts each micro-VM in the enterprise into a honeypot and automates the often prolonged post-attack malware analysis process. An entire attack is automatically and instantly forwarded to the Lava console, which provides an automatic in-depth analysis of the advanced malware.
Network Storage
Video and social network communications from mobile devices with always-on technology has mushroomed data flows. In the enterprise, big data analytics relies on huge volumes of unstructured data, itself often comprised of large file formats that require secure storage and fast retrieval capacity. Network data volumes are moving from exabyte to zettabyte levels of data and higher. Most pundits and some analyst firms predict traffic and storage volumes will continue to double every two years. Next-generation storage systems include hyperscale data storage, virtualisation to improve utilisation, cloud storage for disaster recovery and lower power consumption to save costs. To enhance storage security, storage systems may incorporate data dispersal and keyless encryption to keep data secure against breaches.
The startup company Solidfire has developed a storage system built on the native ability to achieve significant scale, guarantee storage performance, and enable complete system automation. Combined with enterprise applications and deeply integrated with key management frameworks, Solidfire delivers validated products that make a next-generation datacentre deployment more cohesive, automated, and dynamically scalable.
At the high end, Insieme Networks is the driving force behind Cisco’s Application Centric Infrastructure (ACI) at the core of Cisco’s long-awaited SDN strategy. The ACI architecture leverages a mix of merchant and custom Asics, along with Cisco’s new line of Nexus 9000 switches and its Application Policy Infrastructure Controller (APIC).
Establishing business models
Startup companies in the network hardware business are not only introducing new technology perspectives, they are also exploring new business models and establishing customer relationships. Building on standardised platforms allows users to do more process management and security tasks themselves. With higher levels of personalisation and control, users can more easily explore alternative business processes and combine functions across different platforms, which translates into faster time to value. 2015 promises to be an exciting year for enterprise IT departments looking to revamp their corporate network infrastructures – they may actually meet their boards’ network targets.
Thanks to Computerweekly for the article.


 Thanks to NMSaaS for the


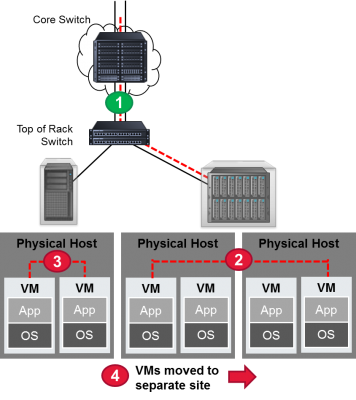
 This diagram should make it a little clearer. It shows the four key visibility points in a virtual network. Point number 1 isn’t a problem. Since the data is transferred from the equipment in one rack to another, this gives the data center administrator an opportunity to use a physical tap to access the data. But for situations 2 through 4, there is no easy access with standard taps and monitoring tools.