Infosim® Global Webinar Day – How to prevent – Or Recover From – a Network Disaster

Oh. My. God. This time it IS the network!

How to prevent – or recover from – a network disaster

Jason Farrer Join Jason Farrer, Sales Engineer with Infosim® Inc. for a Webinar and Live Demo on “How to prevent – or recover from – a network disaster”.Join Jason Farrer, Sales Engineer with Infosim® Inc. for a Webinar and Live Demo on “How to prevent – or recover from – a network disaster”.
 

This Webinar will provide insight into:

  • Why is it important to provide for a network disaster?
  • How to deal with network disaster scenarios [Live Demo]
  • How to prevent network corruption & enhance network security

Watch Now!

Infosim® Global Webinar Day August 27th, 2015

A recording of this Webinar will be available to all who register!
(Take a look at our previous Webinars here.)

Thanks to Infosim for the article.

A Simple Solution To Combatting Virtual Data Center Blind Spots

Blind spots are a long-established threat to virtual data centers. They are inherent to virtual machine (VM) usage and technology due to the nature of VMs, lack of visibility for inter- and intra-VM data monitoring, the typical practices around the use of VM’s, and the use of multiple hypervisors in enterprise environments.

Virtual machines by their nature hide inter- and intra-VM traffic. This is because the traffic stays within in a very small geographic area. As I mentioned in a previous blog, Do You Really Know What’s Lurking in Your Data Center?, Gartner Research found that 80% of VM traffic never reaches the top of the rack where it can be captured by traditional monitoring technology. This means that if something is happening to that 80% of your data (security threat, performance issue, compliance issue, etc.), you’ll never know about it. This is a huge area of risk.

In addition, an Ixia conducted market survey on virtualization technology released in March 2015, exposed a high propensity for data center blind spots to exist due to typical data center practices. This report showed that there was probably hidden data, i.e. blind spots, existing on typical enterprise data networks due to inconsistent monitoring practices, lack of monitoring practices altogether in several cases, and the typical lack of one central group responsible for collecting monitoring data.

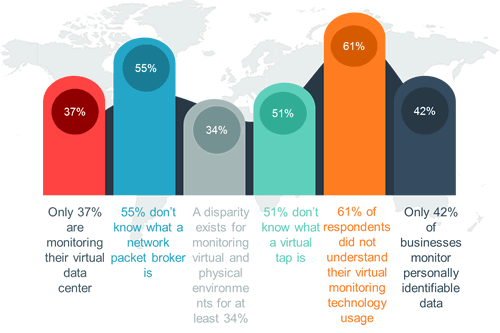
For instance, only 37% of the respondents were monitoring their virtualized environment with the same processes that they use in their physical data center environments, and what monitoring was done usually used less capabilities in the virtual environment. This means that there is a potential for key monitoring information to NOT be captured for the virtual environment, which could lead to security, performance, and compliance issues for the business. In addition, only 22% of business designated the same staff to be responsible for monitoring and managing their physical and virtual technology monitoring. Different groups being responsible for monitoring practices and capabilities often leads to inconsistencies in data collection and execution of company processes.

The survey further revealed that only 42% of businesses monitor the personally identifiable information (PII) transmitted and stored on their networks. At the same time, 2/3 of the respondents were running critical applications across within their virtual environment. Mixed together, these “typical practices” should definitely raise warning signs for IT management.

Additional research by firms like IDC and Gartner are exposing another set of risks for enterprises around the use of multiple hypervisors in the data center. For instance, the IDC Virtualization and the Cloud 2013 study found that 16% of customers had already deployed or were planning to deploy more than one hypervisor. Another 45% were open to the idea in the future. In September 2014, another IDC market analysis stated that now over half of the enterprises (51%) have more than one type of hypervisor installed. Gartner ran a poll in July 2014 that also corroborated that multiple hypervisors were being used in enterprises.

This trend is positive, as having a second hypervisor is a good strategy for an enterprise. Multiple hypervisors allow you to:

  • Negotiate pricing discounts by simply having multiple suppliers
  • Help address corporate multi-vendor sourcing initiatives
  • Provide improved business continuity scenarios for product centric security threats

But it is also very troubling, because the cons include:

  • Extra expenses for the set-up of a multi-vendor environment
  • Poor to no visibility into a multi-hypervisor environment
  • An increase in general complexity (particularly management and programming)
  • And further complexities if you have advanced data center initiatives (like automation and orchestration)

One of the primary concerns is lack of visibility. With a proper visibility strategy, the other cons of a multi-hypervisor environment can be either partially or completely mitigated. One way to accomplish this goal is to deploy a virtual tap that includes filtering capability. The virtual tap allows you the access to all the data you need. This data can be forwarded on to a packet broker for distribution of the information to the right tool(s). Built-in filtering capability is an important feature of the virtual tap so that you can limit costs and bandwidth requirements.

Blind spots that can create the following issues:

  • Hidden security issues
  • Inadequate access to data for trending
  • Inadequate data to demonstrate proper regulatory compliance policy tracking

Virtual taps (like the Ixia Phantom vTap) address blind spots and their inherent dangers.

If the virtual tap is integrated into a holistic visibility approach using a Visibility Architecture, you can streamline your monitoring costs because instead of having two separate monitoring architectures with potentially duplicate equipment (and duplicate costs), you have one architecture that maximizes the efficiency of all your current tools, as well any future investments. When installing the virtual tap, the key is to make sure that it installs into the Hypervisor without adversely affecting the Hypervisor. Once this is accomplished, the virtual tap will have the proper access to inter and intra-VMs that it needs, as well as the ability to efficiently export that information. After this, the virtual tap will need a filtering mechanism so that exported data can be “properly” limited so as not to overload the LAN/WAN infrastructure. The last thing you want to do is to cause any performance problems to your network. Details on these concepts and best practices are available in the whitepapers Illuminating Data Center Blind Spots and Creating A Visibility Architecture.

As mentioned earlier, a multi-hypervisor environment is now a fact for the enterprise. The Ixia Phantom Tap supports multiple hypervisors and has been optimized for VMware ESX and kernel virtual machine (KVM) environments. KVM is starting to make a big push into the enterprise environment. It has been part of the Linux kernel since 2007. According to IDC, shipments of the KVM license were around 5.2 million units in 2014 and they expect that number to increase to 7.2 million by 2017. A lot of the KVM ecosystem is organized by the Open Virtual Alliance and the Phantom vTap supports this recommendation.

To learn more, please visit the Ixia Phantom vTap product page, the Ixia State of Virtualization for Visibility Architectures 2015 report or contact us to see a Phantom vTap demo!

Additional Resources:

Ixia Phantom vTap

Ixia State of Virtualization for Visibility Architectures 2015 report

White Paper: Illuminating Data Center Blind Spots

White Paper: Creating A Visibility Architecture

Blog: Do You Really Know What’s Lurking in Your Data Center?

Solution Focus Category

Network Visibility

Thanks to Ixia for the article.

Ixia Exposes Hidden Threats in Encrypted Mission-Critical Enterprise Applications

Delivers industry’s first visibility solution that includes stateful SSL decryption to improve application performance and security forensics

Ixia (Nasdaq: XXIA), a leading provider of application performance and security resilience solutions, announced it has extended its Application and Threat Intelligence (ATI) Processor™ to include stateful, bi-directional SSL decryption capability for application monitoring and security analytics tools. Stateful SSL decryption provides complete session information to better understand the transaction as opposed to stateless decryption that only provides the data packets. As the sole visibility company providing stateful SSL decryption for these tools, Ixia’s Visibility Architecture™ solution is more critical than ever for enterprise organizations looking to improve their application performance and security forensics.

“Together, FireEye and Ixia offer a powerful solution that provides stateful SSL inspection capabilities to help protect and secure our customer’s networks,” said Ed Barry, Vice President of Cyber Security Coalition for FireEye.

As malware and other indicators of compromise are increasingly hidden by SSL, decryption of SSL traffic for monitoring and security purposes is now more important for enterprises. According to Gartner research, for most organizations, SSL traffic is already a significant portion of all outbound Web traffic and is increasing. It represents on average 15 percent to 25 percent of total Web traffic, with strong variations based on the vertical market.1 Additionally, compliance regulations such as the PCI-DSS and HIPAA increasingly require businesses to encrypt all sensitive data in transit. Finally, business applications like Microsoft Exchange, Salesforce.com and Dropbox run over SSL, making application monitoring and security analytics much more difficult for IT organizations.

Enabling visibility without borders – a view into SSL

In June, Ixia enabled seamless visibility across physical, virtual and hybrid cloud data centers. Ixia’s suite of virtual visibility products allows insight into east-west traffic running across the modern data center. The newest update, which includes stateful SSL decryption, extends security teams’ ability to look into encrypted applications revealing anomalies and intrusions.

Visibility for better performance – improve what you can measure

While it may enhance security of transferred data, encryption also limits network teams’ ability to inspect, tune and optimize the performance of applications. Ixia eliminates this blind spot by providing enterprises with full visibility into mission critical applications.

The ATI Processor works with Ixia’s Net Tool Optimizer® (NTO™) solution and brings a new level of intelligence to network packet brokers. It is supported by the Ixia Application & Threat Intelligence research team, which provides fast and accurate updates to application and threat signatures and application identification code. Additionally, the new capabilities will be available to all customers with an ATI Processor and an active subscription.

To learn more about Ixia’s latest innovations read:

ATI processor

Encryption – The Next Big Security Threat

Thanks to Ixia for the article. 

The Top 3 Reasons Why Network Discovery is Critical to IT Success

Network discovery is the process of identifying devices attached to a network. It establishes the current state and health of your IT infrastructure.

It’s essential for every business due to the fact that without the visibility into your entire environment you can’t successfully accomplish even the basics of network management tasks.

When looking into why Network Discovery is critical to IT success there are three key factors to take into consideration.

1. Discovering the Current State & Health of the Infrastructure.

Understanding the current state and health of the network infrastructure is a fundamental requirement in any infrastructure management environment. What you cannot see you cannot manage, or even understand, so it is vital for infrastructure stability to have a tool that can constantly discover the state and health of the components in operation.

2. Manage & Control the Infrastructure Environment

  • Once you know what you have its very easy to compile an accurate inventory of the following:
  • The environment’s components provide the ability to track hardware.
  • To manage end-of-life and end‑of‑support.
  • The hardware threshold management (i.e. Swap-Out device before failure)
  • To effectively manage the estates operating systems and patch management.

3. Automate Deployment

Corporation’s today place a lot of emphasis on automation therefore, it is very important that when choosing a Network Discovery tool to operate your infrastructure environment, it can integrate seamlessly with your CRM system. Having a consistent view of the infrastructure inventory and services will allow repeatable and consistent deployment of hardware and configuration in order to automate service fulfillment and deployment.

If you’re not using network discovery tool don’t worry were offering the service for absolutely free, just click below and you will be one step closer to improving your network management system.

The Top 3 Reasons Why Network Discovery is Critical to IT Success

Thanks to NMSaaS for the article. 

CVE-2015-5119 and the Value of Security Research and Ethical Disclosure

The Hacking Team’s Adobe Flash zero day exploit CVE-2015-5119, as well as other exploits, were recently disclosed.

Hacking Team sells various exploit and surveillance software to government and law enforcement agencies around the world. In order to keep their exploits working as long as possible, Hacking Team does not disclose their exploits. As such, the vulnerabilities remain open until they are discovered by some other researcher or hacker and disclosed.

This particular exploit is a fairly standard, easily weaponizable use-after-free—a type of exploit which accesses a pointer that points to already free and likely changed memory, allowing for the diversion of program flow, and potentially the execution of arbitrary code. At the time of this writing, the weaponized exploits are known to be public.

What makes this particular set of exploits interesting is less how they work and what they are capable of (not that the damage they are able to do should be downplayed: CVE-2015-5119 is capable of gaining administrative shell on the target machine), but rather the nature of their disclosure.

This highlights the importance of both security research and ethical disclosure. In a typical ethical disclosure, the researcher contacts the developer of the vulnerable product, discloses the vulnerability, and may even work with the developer to fix it. Once the product is fixed and the patch enters distribution, the details may be disclosed publically, which can be useful learning tools for other researchers and developers, as well as for signature development and other security monitoring processes. Ethical disclosure serves to make products and security devices better.

Likewise, security research itself is important. Without security research, ethical disclosure isn’t an option. While there is no guarantee that the researchers will find the exact vulnerabilities held secret by the likes of Hacking Team, the probability goes up as the number and quality of researches increases. Various incentives exist, from credit given by the companies and on vulnerability databases, to bug bounties, some of which are quite substantial (for instance, Facebook has awarded bounties as high as $33,500 at the time of this writing).

However some researchers, especially independent researchers, may be somewhat hesitant to disclose vulnerabilities, as there have been past cases where rather than being encouraged for their efforts, they instead faced legal repercussions. This unfortunately discourages security research, allowing for malicious use of exploits to go unchecked in these areas.

Even in events such as the sudden disclosure of Hacking Team’s exploits, security research was again essential. Almost immediately, the vendors affected began patching their software, and various security researchers developed penetration test tools, IDS signatures, and various other pieces of security related software as a response to the newly disclosed vulnerabilities.

Security research and ethical disclosure practices are tremendously beneficial for a more secure Internet. Continued use and encouragement of the practice can help keep our networks safe. Ixia’s ATI subscription program, which is releasing updates that mitigate the damage the Hacking Team’s now-public exploits can do, helps keep network security resilience at its highest level.

Additional Resources:

ATI subscription

Malwarebytes UnPacked: Hacking Team Leak Exposes New Flash Player Zero Day

Thanks to Ixia for the article

3 Steps to Configure Your Network For Optimal Discovery

All good network monitoring / management begins the same way – with an accurate inventory of the devices you wish to monitor. These systems must be on boarded into the monitoring platform so that it can do its job of collecting KPI’s, backing up configurations and so on. This onboarding process is almost always initiated through a discovery process.

This discovery is carried out by the monitoring system and is targeted at the devices on the network. The method of targeting may vary, from a simple list of IP addresses or host names, to a full subnet discovery sweep, or even by using an exported csv file from another system. However, the primary means of discovery is usually the same for all Network devices, SNMP.

Additional means of onboarding can (and certainly do) exist, but I have yet to see any full-featured management system that does not use SNMP as one of its primary foundations.

SNMP has been around for a long time, and is well understood and (mostly) well implemented in all major networking vendors’ products. Unfortunately, I can tell you from years of experience that many networks are not optimally configured to make use of SNMP and other important configuration options which when setup correctly will optimize the network for a more efficient and ultimately more successful discovery and onboarding process.

Having said that, below are 3 simple steps that should be taken, in order to help maximize your network for optimal discovery.

1) Enable SNMP

Yes it seems obvious to say that if SNMP isn’t enabled then it will not work. But, as mentioned before it still astonishes me how many organizations I work with that still do not have SNMP enabled on all of the devices they should have. These days almost any device that can connect to a network usually has some SNMP support built in. Most networks have SNMP enabled on the “core” devices like Routers / Switches / Servers, but many IT pros many not realize that SNMP is available on non- core systems as well.

Devices like VoIP phones and video conferencing systems, IP connected security cameras, Point of Sale terminals and even mobile devices (via apps) can support SNMP. By enabling SNMP on as many possible systems in the network, the ability to extend the reach of discovery and monitoring has grown incredibly and now gives visibility into the network end-points like never before.

2) Setup SNMP correctly

Just enabling SNMP isn’t enough – the next step is to make sure it is configured correctly. That means removing / changing the default Read Only (RO) community string (which is commonly set by default to “public”) to a more secure string. It is also best practice to use as few community strings as you can. In many large organizations, there can be some “turf wars” over who gets to set these strings on systems. The Server team may have one standard string and the network team has another.

Even though most systems will allow for multiple strings, it is generally best to try to keep these as consistent as possible. This helps prevent confusion when setting up new systems and also helps eliminate unnecessary discovery overhead on the management systems (which may have to try multiple community strings for each device on an initial discovery run). As always, security is important, so you should configure the IP address of the known management server as an allowed SNMP system and block any other systems from being allowed to run an SNMP query against your systems.

3) Enable Layer 2 discovery protocols

In your network, you want much deeper insight into not only what you have, but how it is all connected. One of the best way to get this information is to enable layer 2 (link layer) discovery abilities. Depending on the vendor(s) you have in your network, this may accomplished with a proprietary protocol like the Cisco Discovery Protocol (CDP) or it may be implemented in a generic standard like the Link Layer Discovery Protocol (LLDP). In either case, by enabling these protocols, you gain valuable L2 connectivity information like connected MAC addresses, VLAN’s, and more.

By following a few simple steps, you can dramatically improve the results of your management system’s onboarding / discovery process and therefore gain deeper and more actionable information about your network.

b2ap3_thumbnail_6313af46-139c-423c-b3d5-01bfcaaf724b.png

Thanks to NMSaaS for the article.

Campus to Cloud Network Visibility

Visibility. Network visibility. Simple terms that are thrown around quite a bit today. But the reality isn’t quite so simple. Why?

Scale for one. It’s simple to maintain visibility for a small network. But large corporate or enterprise networks? That’s another story altogether. Visibility solutions for these large networks have to scale from one end of the network to the other end – from the campus and branch office edge to the data center and/or private cloud. Managing and troubleshooting performance issues demands that we maintain visibility from the user to application and every step or hop in between.

So deploying a visibility architecture or design from campus to cloud requires scale. When I say scale, I mean scale on multiple layers – 5 layers to be exact – product, portfolio, design, management, and support. Let’s look at each one briefly.

Product Scale

Building an end-to-end visibility architecture for an enterprise network requires products that can scale to the total aggregate traffic from across the entire network, and filter that traffic for distribution to the appropriate monitoring and visibility tools. This specifically refers to network packet brokers that can aggregate traffic from 1GE, 10GE, 40GE, and even 100GE links. But it is more than just I/O. These network packet brokers have to have capacity that scales – meaning they have to operate at wire rate – and provide a completely non-blocking architecture whether they exist in a fixed port configuration or a modular- or chassis-based configuration.

Portfolio Scale

Building an end-to-end visibility architecture for an enterprise network also requires a portfolio that can scale. This means a full portfolio selection of network taps, virtual taps, inline bypass switches, out-of-band network packet brokers, inline network packet brokers, and management. Without these necessary components, your designs are limited and your future flexibility is limited.

Design Scale

Building an end-to-end visibility architecture for an enterprise network also requires a set of reference designs or frameworks that can scale. IT organizations expect their partners to provide solutions and not simply product – partners that can provide architectures or design frameworks that solve the most pressing challenges that IT is grappling with on a regular basis.

Management Scale

Building an end-to-end visibility architecture for an enterprise network requires management scale. Management scale is pretty much self-explanatory – a management solution that can manage the entire portfolio of products used in the overall design framework. However, it goes beyond that. Management requires integration. Look for designs that can also integrate easily into existing data center management infrastructures. Look for designs that allow automated service or application provisioning. Automation can really help to provide management scalability.

Support Scale

Building and supporting an end-to-end visibility architecture for an enterprise network requires support services that scale, both in skills sets and geography. Skill sets implies that deployment services and technical support personnel understand more than simply product, but that they understand the environments in which these visibility architectures operate as well. And obviously support services must be 24 x 7 and cover deployments globally.

So, if you’re looking to build an end-to-end visibility solution for your enterprise network, consider the scalability of the solution you’re considering. Consider scale in every sense of the word, not simply product scale. Deploying campus to cloud visibility requires scale from product, to portfolio, to design, to management, to support.

Additional Resources:

Ixia network visibility solutions

Ixia network packet brokers

Thanks to Ixia for the article

Top 10 Key Metrics for NetFlow Monitoring

NetFlow is a feature that was introduced on Cisco routers that provides the ability to collect IP network traffic as it enters or exits an interface. By analyzing the data provided by NetFlow, a network administrator can determine things such as the source and destination of traffic, class of service, and the causes of congestion.

There are numerous key metrics when it comes to Netflow Monitoring:

1-Netflow Top Talkers

The flows that are generating the heaviest system traffic are known as the “top talkers.” The NetFlow Top Talkers feature allows flows to be sorted so that they can be viewed, to identify key users of the network.

2-Application Mapping

Application Mapping lets you configure the applications identified by NetFlow. You can add new applications, modify existing ones, or delete them. It’s also usually possible to associate an IP address with an application to help better track applications that are tied to specific servers.

3-Alert profiles

Alert profiles makes network monitoring using NetFlow easier. It allows for the Netflow system to be watching the traffic and alarming on threshold breaches or other traffic behaviors.

4-IP Grouping

You can create IP groups based on IP addresses and/or a combination of port and protocol. IP grouping is useful in tracking departmental bandwidth utilization, calculating bandwidth costs and ensuring appropriate usage of network bandwidth.

5-Netflow Based Security features

NetFlow provides IP flow information in the network. In the field of network security, IP flow information provided by NetFlow is used to analyze anomaly traffic. NetFlow based anomaly traffic analysis is an appropriate supplement to current signature-based NIDS.

6- Top Interfaces

Included in the Netflow Export information is the interface that the traffic passes through. This can be very useful when trying to diagnose network congestion, especially on lower bandwidth WAN interfaces as well as helping to plan capacity upgrades / downgrades for the future.

7- QoS traffic Monitoring

Most networks today enable some level of traffic prioritization. Multimedia traffic like VoIP and Video which are more susceptible to problems when there are network delays typically are tagged as higher priority than other traffic like web and email. Netflow can track which traffic is tagged with these priority levels. This enables network engineers to make sure that the traffic is being tagged appropriately.

8- AS Analysis

Most Netflow tools are able to also show the AS (Autonomous System) number and well known AS assignments for the IP traffic. This can be very useful in peer analysis as well as watching flows across the “border” of a network. For ISP’s and other large organizations this information can be helpful when performing traffic and network engineering analysis especially when the network is being redesigned or expanded.

9- Protocol analysis

One of the most basic metrics that Netflow can provide is a breakdown of TCP/IP protocols in use on the network like TCP, UDP, ICMP etc. This information is typically combined with port and IP address information to provide a complete view of the applications on the network.

10- Extensions with IPFIX

Although technically not NetFlow, IPFIX is fast becoming the preferred method of “flow-based” analysis. This is mainly due to the flexible structure of IPFIX which allows for variable length fields and proprietary vendor information. This is critical when trying to understand deeper level traffic metrics like HTTP host, URLs, messages and more.

Thanks to NMSaaS for the article. 

NTO Now Provides Twice the Network Visibility

Ixia is proud to announce that we are expanding one of the key capabilities in Ixia xStream platforms, “Double Your Ports,” to our Net Tool Optimizers (NTO) family of products. As of our 4.3 release, this capability to double the number of network and monitor inputs is now available on the NTO platform. If you are not familiar with Double Your Ports, it is a feature that allows you to add additional network or tool ports to your existing NTO by allowing different devices to share a single port. For example, if you have used all of the ports on your NTO but want to add a new tap, you can enable Double Your Ports so that a Net Optics Tap and a monitoring tool can share the same port, utilizing both the RX and TX sides of the port. This is how it works:

Standard Mode

In the standard mode, the ports will behave in a normal manner: when there is a link connection on the RX, the TX will operate. When the RX is not connected, the system assumes the TX link is also not connected (down).

Loopback Mode

When you designate a port to be loopback, the data egressing on the TX side will forward directly to the RX side of the same port. This functionality does not require a loopback cable to be plugged into the port. The packets will not transmit outside of the device even if a cable is connected.

Simplex Mode

When you designate a port to be in simplex mode, the port’s TX state is not dependent on the RX state. In the standard mode, when the RX side of the port goes down, the TX side is disabled. If you assign a port mode to simplex, the TX state is up when there is a link on the TX even when there is no link on the RX. You could use a simplex cable to connect a TX of port A to an RX of port B. If port A is in simplex mode, the TX will transmit even when the port A RX is not connected.

To “double your ports” you switch the port into simplex mode, then use simplex fiber cables and connect the TX fiber to a security or monitoring tool and the RX fiber to a tap or switch SPAN port. On NTO, the AFM ports such as the AFM 16 support simplex mode allowing you to have 32 connections per module: 16 network inputs and 16 monitor outputs simultaneously (with advanced functions on up to 16 of those connections). The Ixia xStream’s 24 ports can be used as 48 connections: 24 network inputs and 24 monitor outputs simultaneously.

The illustration below shows the RX and TX links of two AFM ports on the NTO running in simplex mode. The first port’s RX is receiving traffic from the Network Tap and the TX is transmitting to a monitoring tool.

The other port (right hand side on NTO) is interconnected to the Network Tap with its RX using a simplex cable whereas its TX is unused (dust-cap installed).

With any non-Ixia solution, this would have taken up three physical ports on the packet broker. With Ixia’s NTO and xStream packet brokers we are able to double up the traffic and save a port for this simple configuration, with room to add another monitoring tool where the dust plug is shown. If you expand this across many ports you can double your ports in the same space!

NTO Now Provides Twice the Network Visibility

Click here to learn more about Ixia’s Net Tool Optimizer family of products.

Additional Resources:

Ixia xStream

Ixia NTO solution

Ixia AFM

Solution Focus Category

Network Visibility

Thanks to Ixia for the article.

“Who Makes the Rules?” The Hidden Risks of Defining Visibility Policies

Imagine what would happen if the governor of one state got to change all the laws for the whole country for a day, without the other states or territories ever knowing about it. And then the next day, another governor gets to do the same. And then another.

Such foreseeable chaos is precisely what happens when multiple IT or security administrators define traffic filtering policies without some overarching intelligence keeping tabs on who’s doing what. Each user acts from their own unique perspective with the best of intentions –but with no way to know how the changes they make might impact other efforts.

In most large enterprises, multiple users need to be able to view and alter policies to maximize performance and security as the network evolves. In such scenarios, however, “last in, first out” policy definition creates dangerous blind spots, and the risk may be magnified in virtualized or hybrid environments where visibility architectures aren’t fully integrated.

Dynamic Filtering Accommodates Multiple Rule-makers, Reduces Risk of Visibility Gap

Among the advances added to latest release of Ixia’s Net Tool Optimizer™ (NTO) network packet brokers are enhancements to the solution’s unique Dynamic Filtering capabilities. This patented technique imposes that overarching intelligence over the visibility infrastructure as multiple users act to improve efficiency or divert threats. This technology becomes an absolute requirement when automation is used in the data center as dynamic changes to network filters require advanced calculations to other filters to ensure overlaps are updated to prevent loss of data.

Traditional rule-based systems may give a false sense of security and leave an organization vulnerable as security tools don’t see everything they need to see in order to do their job effectively. Say you have 3 tools each requiring slightly different but overlapping data.

  • Tool 1 wants a copy of all packets on VLAN 1-3
  • Tool 2 wants a copy of all packets containing TCP
  • Tool 3 wants a copy of all packets on VLAN 3-6

Overlap occurs in that both Tools 1 and 3 need to see TCP on VLAN 3. In rule-based systems, once a packet matches a rule, it is forwarded on and no longer available. Tool 1 will receive TCP packets on VLAN 3 but not tool 3. This creates a false sense of security because tool 3 still receives data and is not generating an alarm, which would indicate all is well. But what if the data stream going to tool 1 contains the smoking gun? Tool 3 would have detected this. And as we know from recent front-page breaches, a single incident can ruin a company’s brand image and have a severe financial impact.

Extending Peace of Mind across Virtual Networks

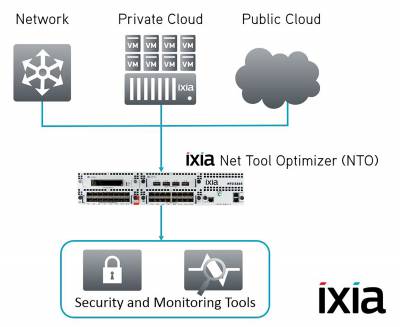
NVOS 4.3 also integrates physical and virtual visibility, allowing traffic from Ixia’s Phantom™ Virtualization Taps (vTaps) or standard VMware-based visibility solutions to be terminated on NTO along with physical traffic. Together, these enhancements eliminate serious blind spots inherent in other solutions avoiding potential risk and, worst case, liability caused by putting data at risk.

Integrating physical and virtual visibility minimizes equipment costs and streamlines control by eliminating extra devices that add complexity to your network. Other new additions –like the “double your ports” feature extend the NTO advantage delivering greater density, flexibility and ROI.

Download the latest NTO NVOS release from www.ixiacom.com.

Additional Resources:

Ixia Visibility Solutions

Thanks to Ixia for the article