Deploy Excellence in Precision Probe Technology Featuring Gen2 Capture Intelligence.
Overview
Key Features
Integration
Deployment
What's New
Tech Specs
Resources
Whether your network stretches across the building or the globe, Observer Probe appliances cover your edge and remote network sites with advanced analysis technologies. They aggregate information across network sites near and far — extending your reach without sacrificing monitoring integrity. The Observer line of software and hardware Probes monitors network activity across multiple topologies with robust intelligence and a menu of rich features. Use Probes for troubleshooting, collecting NetFlow data, proactive monitoring, long-term data collection, network forensics, and more.
As enterprise networks continue growing, Probes provide performance management support for multiple departments, locations, business functions and remote users. This robust remote monitoring solution when used with a console, gives IT managers and engineers the power to proactively monitor, troubleshoot, and respond to network problems from any location. Probes offer deep insights and 360 degrees of visibility into every element of an organization’s business-critical IT infrastructure. Choose software Probe options or from a variety of pre-configured rack mount systems for an easy, cost-effective way to monitor any part of the network.
Benefits
- Gain insight and visibility into the entire network
- Manage remote networks as easily as local
- Aggregate information across sites for global health
- Get support for the following topologies:
- LAN
- Gigabit, 10 Gb, and 40 Gb
- Wireless (802.11 a/b/g/n)
- Fault tolerant 1U and 2U chassis.
Use Observer Probes with Observer Analyzer and Observer Apex to deploy features that quickly help troubleshoot and resolve issues. Probes are hardware appliances that run Observer Probe Instance Software, providing enterprise-wide views of network traffic. With Probes, there's no added time or expense involved traveling to remote sites when a problem occurs – see everything you need from your desktop.
Use Probes as a part of the Observer Performance Management Platform to get the following features and more:
Access the Power of Probes Plus Analyzer
Monitor and troubleshoot critical network links in any location in real time, using the Probe-Analyzer power duo.Probes report to the Analyzer console for complete video monitoring support to tracking end-user experience.
Features include:
- Expert Analytics
- Alerts
- Metrics
- Packet Capture
- In-Depth Details
Pair Probes with Apex for Greater Visibility
Get a top-down approach that combines enterprise-wide views, macro- and micro-level reporting, and deep drill-down for problem resolution with Apex.
Features include:
- Full-Featured Reporting
- Trending
- Baselining
- Aggregate Visibility
Increase Troubleshooting Efficiency
Accelerate troubleshooting with Probes using real-time Expert Analysis locally at the Probe, without transferring captured data back to the console.
Get Unmatched Distributed Visibility
Distributed visibility is offered with Probes. Deploy Probes to various observation points to monitor traffic, correlate analysis, and more.
See All Your Data with Flow Aggregation
View the complete picture with flow data aggregationfor a unified report of all network sites.
Optimize New Technology
Probes assist with reporting on key technology initiatives such as UC, virtualization, and cloud.
For companies that can't invest in dedicated Hardware Probes, Observer Software Probes provide a low-cost monitoring alternative. Easy to install and configure, they support Ethernet, Gigabit, and wireless. Ideal for analyzing low-utilization gigabit network speeds, the Observer line features a variety of Software Probes.
Also available, Observer Hardware Probes can manage high-utilization, full-duplex gigabit or 10 Gb networks.
Whether Hardware or Software, Probes can be selected to meet the specific needs of your organization.
Observer Platform Integration
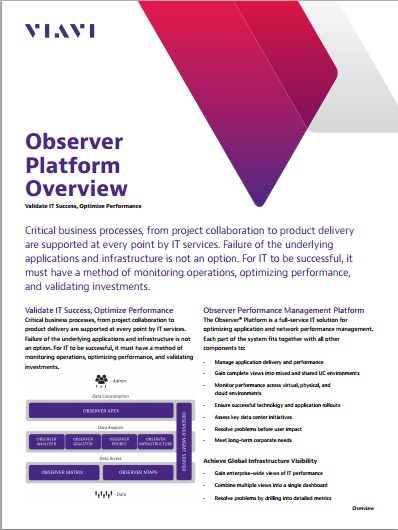
Observer Probes are part of the Observer Performance Management Platform. They work with Analyzer consoles for analysis and Apex for high-level performance visibility.
- Probes work with Analyzer to provide Distributed Analysis which includes: App Performance Analysis, App Transaction Analysis, comparison analysis, traffic flows, visibility into other environments, and more.
- Paired with Analyzer, Probes also provide detailed information across multiple segments, multiple locations, and across heterogeneous environments.
- Probes provide remote visibility when used with Apex, a data source for the high-level reporting environment.
- Drilldown from Apex into Probes provides root-cause analysis for problem resolution.

How are Observer Probes Deployed?
Observer Probe placement is critical. Failure to deploy the right probes in the right place can result in network blind spots, leading to inefficient troubleshooting and expensive mistakes. It's also essential to place Probes in high-traffic areas to capture the data you need.
Since a Probe only shows the analysis data it can see, where to deploy Probes depends on your network's architecture and where visibility is needed. For example, an Ethernet Probe's visibility is limited to what a particular switch's SPAN/mirror port can deliver. A specialized Hardware Probe connected through a TAP sees only the traffic traversing that link. If you want 100 percent coverage, install TAPs on all the high-speed critical links in or near the core of your network, and plug Probes into the SPAN/mirror ports of switches on the edge.
Best Practices
Hardware Probes:
- Consider whether you want to use SPAN vs. TAP.
- Network Core: Use Gigabit, 10 Gb, and 40 Gb appliances
- Network Edge: Ethernet Probe appliances
Software Probes:
- Appropriate for analyzing speeds of up for low-utilization gigabit networks via a SPAN port on a switch.
When sharing files or filters between Probes, updating Probes, and for Probe authentication, use a Probe management tool like Observer Management Server, a centralized Probe management system for enterprise networks.
Fault tolerant 1U or 2U chassis
All hardware Probes are now built on a rock-solid 1U or 2U enclosure that offers high levels of fault tolerance and optimal performance.
Native IPv6 Communications
Get advanced support for IPv6 environments. As you shift to IPv6-based networks, the Observer Platform provides native IPv6 communications options within pure IPv6 and mixed IPv6/IPv4 environments.
Gen2 Capture Card Enhancements
- Faster, more flexible gigabit and 10 Gb packet capture and RNA
- Synchronized hardware-accelerated filtering for up to 12 ports
- Flexible hardware deduplication (100 percent dedupe efficiency, no latency introduced)
Probe Centric Analysis
Observer Platform users can now add more points of visibility without impacting network traffic. This allows for:
- 97 percent reduction in overhead and bandwidth
- Ideal for the world’s largest analysis deployments
- Increased scalability in enterprise environments
With several options available, Observer Probes are purpose-built to meet your needs. Use the technical specifications to help identify the right Probes for your Observer Performance Management Platform deployment.
Software Probe System Requirements
Minimum
Dual-core; 2 GB memory; Windows 7 64 bit; one copper or fiber 10/100/1000 Ethernet monitoring port in addition to an out-of-band Ethernet management port.
Recommended
Quad-core; 8 GB memory; Windows 7 64 bit; two copper or fiber 10/100/100 Ethernet ports, in addition to an out-of-band Ethernet management port.
Hardware Probe Tech Specifications
All Hardware Probe appliances connect to any Observer Analyzer Expert Edition or Suite console on the network. Observer Probe appliance units include all required cabling, and a 10/100/1000 Ethernet management port.
| Model | Description |
| 10 Gb Probe | High-Performance Monitoring |
| Ethernet Probe | Single, Multi or Expert Versions |
| Gigabit Probe | Supports up to 6 links (or 12 ports) |
10 Gb Probe
Technical Specifications
Monitor your high speed core and distribution link connections to assure optimal performance and troubleshoot anomalies.
Standard Memory
32 GB RAM (16 for operating system, 16 for Observer Analyzer)
10 Gb Link Support
1, 2, 4, or 6 Links (2, 4, 8, and 12 ports)
Additional Hardware
Includes network TAPs and media kit(s)
Capture Card
Custom-designed full-duplex Gen2 Gigabit Capture Card
Key Remote Capabilities:
Web-based management
Graceful power shutdown, startup, and reboot
Pager and email alerts
Operating Temperature
32 F (0 C) to 104 F (40 C)
Power Consumption (Full Load)
Input voltage: 100V-240V auto select
Input frequency: 50/60Hz
260W (887 Btu/h) (1, 2, or 4 Links)
267W (911 Btu/h) (6 Links)
Dimensions (1, 2, or 4 Links)
2U 19-inch rack-mountable appliance
19 in (W) x 3.48 in (H) x 26.01 in (mounting depth)
(Full depth with handles: 28 in)
48.3 cm (W) x 8.8 cm (H) x 66.1 cm (mounting depth)
(Full depth with handles: 71.1 cm)
Dimensions (6 Links)
4U 19-inch rack-mountable appliance
16.75 in (W) x 6.94 in (H) x 26.38 in (mounting depth)
(Full probe depth with handles: 28.13 in)
42.5 cm (W) x 17.6 cm (H) x 67.0 (mounting depth)
(Full probe depth with handles: 71.5 cm)
Weight (1, 2, or 4 Links)
55 lbs (25 kg) / mounting rails: 9 lbs (4.1 kg)
Weight (6 Links)
47 lbs (21 kg) / mounting rails: 9 lbs (4.1kg)
Ethernet Probe
Technical Specifications
Cost effectively monitors your low utilization edge or remote branch locations. Choose from Single, Multi or Expert probe versions. Optional redundant power supply is available.
Standard Memory
8 GB RAM (single probe), 8 GB RAM (4 for operating system, 4 for Observer Analyzer—multi or expert probe)
10/100/1000 Port Support
1 or 2 ports (single is only 1 port)
Key Remote Capabilities:
Web-based management
Graceful power shutdown, startup, and reboot
Power Consumption (Full Load)
Input voltage: 100V-240V auto select
Input frequency: 50/60Hz
115W (392 Btu/h)
Operating Temperature
32 F (0 C) to 104 F (40 C)
Dimensions
19 in (W) x 1.73 in (H) x 25.76 in (mounting depth)
48.3 cm (W) x 4.4 cm (H) x 65.4 cm (mounting depth)
Weight
27 lbs (12 kg)
Lights Out Capability
Manage, monitor and control the probe remotely through an intuitive web-based IPMI (Intelligent Platform Management Interface) v2.0 port.
Gigabit Probe
Technical Specifications
Capture your gigabit network traffic and perform high-speed analysis utilizing our in-house designed Gen2 capture card.
Standard Memory
32 GB RAM (16 for operating system, 16 for Observer Analyzer)
Gigabit Link Support
1, 2, 4, or 6 Links (2, 4, 8, and 12 ports)
Additional Hardware
Includes network TAPs and media kit(s)
Capture Card
Custom-designed full-duplex Gen2 Gigabit Capture Card
Key Remote Capabilities:
Web-based management
Graceful power shutdown, startup, and reboot
Pager and email alerts
Operating Temperature
32 F (0 C) to 104 F (40 C)
Power Consumption (Full Load)
Input voltage: 100V-240V auto select
Input frequency: 50/60Hz
244W (833 Btu/h) (1, 2, or 4 Links)
253W (863 Btu/h) (6 Links)
Dimensions (1, 2, or 4 Links)
2U 19-inch rack-mountable appliance
19 in (W) x 3.48 in (H) x 26.01 in (mounting depth)
(Full depth with handles: 28 in)
48.3 cm (W) x 8.8 cm (H) x 66.1 cm (mounting depth)
(Full depth with handles: 71.1 cm)
Dimensions (6 Links)
4U 19-inch rack-mountable appliance
16.75 in (W) x 6.94 in (H) x 26.38 in (mounting depth)
(Full probe depth with handles: 28 in)
42.5 cm (W) x 17.6 cm (H) x 67.0 (mounting depth)
(Full probe depth with handles: 71.1 cm)
Weight (1, 2, or 4 Links)
60 lbs (27.2 kg) / mounting rails: 9 lbs (4.1 kg)
Weight (6 Links)
47 lbs (21 kg) / mounting rails: 9 lbs (4.1kg)


