Will You Find the Needle in the Haystack? Visibility with Overlapping Filters

When chasing security or performance issues in a data center, the last thing you need is packet loss in your visibility fabric. In this blog post I will focus on the importance of how to deal with multiple tools with different but overlapping needs.

Dealing with overlapping filters is critical, in both small and large visibility fabrics. Lost packets occur when filter overlaps are not properly considered. Ixia’s NTO is the only visibility platform that dynamically deals with all overlaps to ensure that you never miss a packet. Ixia Dynamic Filters ensure complete visibility to all your tools all the time by properly dealing with “overlapping filters.” Ixia has over 7 years invested in developing and refining the filtering architecture of NTO, it’s important to understand the problem of overlapping filters.

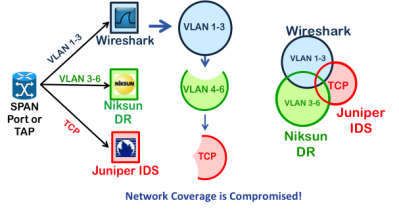
What are “overlapping filters” I hear you ask? This is easiest explained with a simple example. Let’s say we have 1 SPAN port, 3 tools, and each tool needs to see a subset of traffic:

Will You Find the Needle in the Haystack? Visibility with Overlapping Filters

Sounds simple, we just want to describe 3 filter rules:

  • Tool 1 wants a copy of all packets on VLAN 1-3
  • Tool 2 wants a copy of all packets containing TCP
  • Tool 3 wants a copy of all packets on VLAN 3-6

Notice the overlaps. For example a TCP packet on VLAN 3 should go to all three tools. If we just installed these three rules we would miss some traffic because of the overlaps. This is because once a packet matches a rule the hardware takes the forwarding action and moves on to examine the next packet.

This is what happens to the traffic when overlaps are ignored. Notice that while the WireShark tool gets all of its traffic because its rule was first in the list, the NikSun and Juniper tools will miss some packets. The Juniper IDS will not see any of the traffic on VLANs 1-6, and the Niksun will not receive packets on VLAN 3. This is bad.

Will You Find the Needle in the Haystack? Visibility with Overlapping Filters

To solve this we need to describe all the overlaps and put them in the right order. This ensures each tool gets a full view of the traffic. The three overlapping filters above result in seven unique rules as shown below. By installing these rules in the right order, each tool will receive a copy of every relevant packet. Notice we describe the overlaps first as the highest priority.

Will You Find the Needle in the Haystack? Visibility with Overlapping Filters

Sounds simple but remember this was a very simple example. Typically there are many more filters, lots of traffic sources, multiple tools, and multiple users of the visibility fabric. As well changes need to happen on the fly easily and quickly without impacting other tools and users.

A simple rule list quickly explodes into thousands of discrete rules. Below you can see two tools and three filters with ranges that can easily result in 1300 prioritized rules. Not something a NetOps engineer needs to deal with when trying to debug an outage at 3am!

Will You Find the Needle in the Haystack? Visibility with Overlapping FiltersConsider a typical visibility fabric with 50 taps, eight tools, and one operations department with three users. Each user needs to not impact the traffic of other users, and each user needs to be able to quickly select the types of traffic they need to secure and optimize in the network.

With traditional rules-based filtering this becomes impossible to manage.

Ixia NTO is the only packet broker that implements Dynamic Filters; other visibility solutions implement rules with a priority. This is the result of many years of investment in filtering algorithms. Here’s the difference:

  • Ixia Dynamic Filters are a simple description of the traffic you want, without any nuance of the machine that selects the traffic for you, other filter interactions, or the complications brought by overlaps.
  • Priority-based rules are lower level building blocks of filters. Rules require the user to understand and account for overlaps and rule priority to select the right traffic. Discrete rules quickly become headaches for the operator.

Ixia Dynamic Filters remove all the complexity by creating discrete rules under the hood, and a filter may require many discrete rules. The complex mathematics required to determine discrete rules and priority are calculated in seconds by software, instead of taking days of human work. Ixia invented the Dynamic filter more than seven years ago, and has been refining and improving it ever since. Dynamic Filtering software allows us to take into account the most complex filtering scenarios in a very simple and easy-to-manage way.

Another cool thing about Ixia Dynamic filter software is that it becomes the underpinnings for an integrated drag and drop GUI and REST API. Multiple users and automation tools can simultaneously interact with the visibility fabric without fear of impacting each other.

Some important characteristics of Ixia’s Dynamic Filtering architecture:

NTO Dynamic Filters handle overlaps automatically—No need to have a PhD to define the right set of overlapping rules.

NTO Dynamic Filters have unlimited bandwidth—Many ports can aggregate to a single NTO filter which can feed multiple tools, there will be no congestion or dropped packets.

NTO Dynamic Filters can be distributed—Filters can span across ports, line cards and distributed nodes without impact to bandwidth or congestion.

NTO allows a Network Port to connect to multiple filters—You can do this:

Will You Find the Needle in the Haystack? Visibility with Overlapping Filters

NTO has 3 stage filtering—Additional filters at the network and tool ports.

NTO filters allow multiple criteria to be combined using powerful boolean logic—Users can pack a lot of logic into a single filter. Each stage supports Pass and Deny AND/OR filters with ‘Source or Destination’, session, and multi-part uni/bi-directional flow options. Dynamic filters also support passing any packets that didn’t match any other Pass filter, or that matched all Deny filters.

NTO Custom Dynamic Filters cope with offsets intelligently—filter from End of L2 or start of L4 Payload skipping over any variable length headers or tunnels. Important for dealing with GTP, MPLS, IPv6 header extensions, TCP options, etc.

NTO Custom Dynamic Filters handle tunneled MPLS and GTP L3/L4 fields at line rate on any port—use pre-defined custom offset fields to filter on MPLS labels, GTP TEIDs, and inner MPLS/GTP IP addresses and L4 ports on any standard network port interface.

NTO provides comprehensive statistics at all three filter stages—statistics are so comprehensive you can often troubleshoot your network based on the data from Dynamic filters alone. NTO displays packet/byte counts at the input and output of each filter along with rates, peak, and charts. The Tool Management View provides a detailed breakdown of the packets/bytes being fed into a tool port by its connected network ports and dynamic filters.

In summary the key benefits you get with Ixia Dynamic filters are:

  • Accurately calculates required rules for overlapping filters, 100% of the time.
  • Reduces time taken to correctly configure rules from days to seconds.
  • Removes human error when trying to get the right traffic to the right tool.
  • Hitless filter installation, doesn’t drop a single packet when filters are installed or adjusted
  • Easily supports multiple users and automation tools manipulating filters without impacting each other
  • Fully automatable via a REST API, with no impact on GUI users.
  • Robust and reliable delivery of traffic to security and performance management tools.
  • Unlimited bandwidth, since dynamic filters are implemented in the core of the ASIC and not on the network or tool port.
  • Significantly less skill required to manage filters, no need for a PhD.
  • Low training investment, managing the visibility fabric is intuitive.
  • More time to focus on Security Resilience and Application Performance

Additional Resources:

Ixia Visibility Architecture

Thanks to Ixia for the article. 

Ixia Study Finds That Hidden Dangers Remain within Enterprise Network Virtualization Implementations

Ixia (Nasdaq: XXIA), a leading provider of application performance and security resilience solutions, announced global survey results demonstrating that while most companies believe virtualization technology is a strategic priority, there are clear risks that need to be addressed. Ixia surveyed more than 430 targeted respondents in South and North America (50 percent), APAC (26 percent) and EMEA (24 percent).

The accompanying report titled, The State of Virtualization for Visibility Architecture™ 2015 highlights key findings from the survey, including:

  • Virtualization technology could create an environment for hidden dangers within enterprise networks. When asked about top virtualization concerns, over one third of respondents said they were concerned with their ability (or lack thereof) to monitor the virtual environment. In addition, only 37 percent of the respondents noted they are monitoring their virtualized environment in the same manner as their physical environment. This demonstrates that there is insufficient monitoring of virtual environments. At the same time, over 2/3 of the respondents are using virtualization technology for their business-critical applications. Without proper visibility, IT is blind to any business-critical east-west traffic that is being passed between the virtual machines.
  • There are knowledge gaps regarding the use of visibility technology in virtual environments. Approximately half of the respondents were unfamiliar with common virtualization monitoring technology – such as virtual tap and network packet brokers. This finding indicates an awareness gap about the technology itself and its ability to alleviate concerns around security, performance and compliance issues. Additionally, less than 25 percent have a central group responsible for collecting and monitoring data, which leads to a higher probability for a lack of consistent monitoring and can pose a huge potential for improper monitoring.
  • Virtualization technology adoption is likely to continue at its current pace for the next two years. Almost 75 percent of businesses are using virtualization technology in their production environment, and 65 percent intend to increase their use of virtualization technology in the next two years
  • Visibility and monitoring adoption is likely to continue growing at a consistent pace. The survey found that a large majority (82 percent) agree that monitoring is important. While 31 percent of respondents indicated they plan on maintaining current levels of monitoring capabilities, nearly 38 percent of businesses plan to increase their monitoring capabilities over the next two years.

“Virtualization can bring companies incredible benefits – whether in the form of cost or time saved,” said Fred Kost, Vice President of Security Solutions Marketing, Ixia. “At Ixia, we recognize the importance of this technology transformation, but also understand the risks that are involved. With our solutions, we are able to give organizations the necessary visibility so they are able to deploy virtualization technology with confidence.”

Download the full research report here.

Ixia's The State of Virtualization for Visibility Achitectures 2015

Thanks to Ixia for the article.

Validating Networks with Ixia

We work with majority the top carriers worldwide, as well as many of their largest customers and the companies who provide infrastructure technology for their networks. We’re the “application performance and security resilience” company – we help you make sure technology works the way you expect it to out of the gate, and keeps on doing it throughout the deployment lifecycle.

Today’s mobile subscribers are what we call “tough customers”: they expect instant availability and high performance, all the time, everywhere they go, and they tend to remember the “hiccups” more than all the times everything works just fine. No one has patience for dropped calls or choppy video or slow downloads anymore.

And that’s where Ixia comes in. We helps carriers and other providers worldwide exceed the expectations of their toughest customers. Physical or virtualized, wired or wireless, we can help you build and validate, secure, and optimize networks that deliver.

We do this with powerful and versatile hardware and software solutions, expert global support, and professional services, all designed to ensure user satisfaction and a great bottom line.

So what does this mean to you? What do “validate,” “secure” and “optimize” mean to you?

Let’s start with “validate,” and the beginning stages of the technology lifecycle.

To meet expectations, network designs, upgrades, and expansions all need to be carefully planned –and proven to work—before new technologies and services are put into production. For this you need real data based on realistic scenarios, and to assess performance from subscribers’ point of view.

You can’t rely on vendor data sheets alone to make decisions about new technologies. These specifications may be based on very specific scenarios that don’t address your unique deployment needs and business usage.

And since we know that retooling a network after a launch costs a lot more than getting it right before you go live, you need to validate critical new technologies yourself.

Ixia solutions are used to validate new products and services end-to-end including:

  • Equipment used in LTE networks, HetNets, and Wi-Fi offload
  • The quality of services like VoLTE and Wi-Fi calling
  • Virtualized network functions—these actually need to be validated throughout migration, using a mix of physical and virtualized testing to net the greatest insights every step of the way

Ixia lets you put new designs to the test designs against real-world scenarios, using real-world traffic. Our hardware and software emulates application traffic, scaling to millions of users, across nearly any link speed – including 400GbE.

And, we can tailor use-case scenarios that specifically match the needs of your network and customers. So you’ll see what they’ll see, and how your network responds to peak traffic and scales to meet rising demand.

We help meet two main goals for nearly every project: faster time to market, and lower cost. In one recent virtualization effort, Ixia helped a provider achieve a 25% performance improvement by identifying latency bottlenecks, along with faster time-to-market at a lower total cost.

And that’s just the beginning!

In today’s market, application traffic IS the network, and providers will increasingly be looking to monetize subscribers’ experience with applications and services.

Validating the performance of applications of the network early on in design is a critical step that can’t be overlooked, and that’s Ixia’s focus. Whether it’s games, social media, online banking, video streaming, online shopping, automotive Ethernet, audio/visual services, or the next big thing, customers expect it to just work, and we help you make sure it does.

Partnering with service providers, equipment providers, and enterprises to seamlessly and securely deliver a quality experience to subscribers and customers is Ixia’s business. Once you validate your network design, we can help secure the rollout, and monitor and optimize performance during operation.

Additional Resources:

Ixia virtualization solutions

Thanks to Ixia for the article.

See How Ixia’s NTO 7300 Vastly Outperforms the Closest Competitor in 100GbE Visibility, Scalability, Capacity, and Cost-Efficiency

Visibility Is an Urgent Challenge

Lack of visibility is behind the worst of IT headaches, leaving the network open to malicious intrusions, as well as compliance, availability, and performance problems. Today’s soaring traffic volumes are bringing greater complexity, proliferating apps and devices, and rising virtual traffic—in fact, “east-west” traffic between virtual machines now makes up half of all traffic on the network. Virtual traffic is the culprit that spawns unmonitored “blind spots,” a breeding ground for errors and attacks.

All these challenges make visibility critical to network security and management. Customers need a highly scalable visibility architecture—one that can eliminate blind spots and reduce complexity, while providing resilience and control. Visibility relies on monitoring tools, and new tool investment can be a real budget-buster. That’s why companies need to protect their investments in 1GbE and 10GbE monitoring tools, and why load balancing has become such a smart approach. Now, as networks move into the 100GbE environment, Ixia offers the NTO 7300, enabling total visibility into multiple 100GbE links and dominating its competition.

Dramatic Design Difference

The NTO 7300 delivers the ability to optimize 1GbE and 10GbE monitoring tools for the intensive 100GbE environment and offers decisive advantages over competitors. No other solution packs as many ports into a compact footprint for industry-leading density and cost-efficiency. The NTO 7300’s one-two punch of design ingenuity plus advanced technology makes it the clear choice in every comparison. If you take a typical 100GbE deployment that requires 8 100GbE ports, advanced filtering, and 10GbE ports for tool access, it becomes clear that other solutions cannot keep up with the density and performance Ixia provides.

The Numbers Speak for Themselves

Compare the Ixia NTO 7300 to its closest competitor, and you see a striking difference in capacity, scalability and performance. The NTO 7300 commands every category for customer needs by providing more performance in 71% less space!

Ixia's Net Tool Optimizer 7300 b2ap3_thumbnail_competitor_0.png
7300: Port-Plentiful

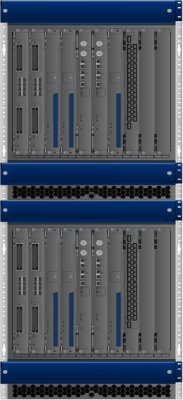
The Ixia NTO7300 configuration fits neatly and entirely in a single 8U chassis, with many unused ports.

Competition: Port-Poor

This competitor requires 28U and has insufficient 40GbE ports. It’s significantly lower in density, with no ports on advanced processing blades and fabric modules placed awkwardly in front.

Per Chassis:24 40GbE ports (or 96x10GbE)

64 10GbE AFM ports

8 100GbE ports

640Gbps Deduplication

Per Chassis (2 chassis required):2x40GbE ports

40x10GbE ports

4x100GbE ports

240Gbps Deduplication

With its “pay as you grow” scalability; savings on rack space and power; a simple, rack-mountable chassis; superior advanced features such as header stripping and deduplication; and wire-speed performance in any configuration, the NTO 7300 is ideal for filling that critical visibility gap in the 100GbE environment.

Ixia NTO7300 Other
Fabric Module location Rear panel Occupy front slots
100GbE configuration 2x100GbE + 4x40GbE or 16x10GbE 2x100GbE + 8x10GbE
Advanced Processing capacity per slot Up to 640Gbps (320Gbps ingress + 320Gbps egress) Up to 80Gbps
Advanced Processing card configuration 2xAFM16s + 4xQSFP + 640Gbps AFM, per slot No tool or network ports, “the other’s” processor only
Slots per chassis 6 8
Chassis RU 8 (with AC shelf) 14
Total Configuration Ixia NTO7300 Other Advantage
10GbE ports 64 (up to 160) 80 (up to 96) Ixia (67% more max)
40GbE ports 96 8* Ixia (1100% more max
100GbE ports 8 8
Deduplication bandwidth 640Gbps 480Gbps* Ixia (33% more)
Total RU 8 28 Ixia (71% less)
*Doesn’t meet requirements

Additional Resources:

Ixia Visibility Architecture

Ixia NTO 7300

Thanks to Ixia for the article.

Ixia’s Virtual Visibility with ControlTower and OpenFlow

Ixia is announcing support for OpenFlow SDN in Ixia’s ControlTower architecture. Our best-in-breed Visibility Architecture now extends data center visibility by taking advantage of a plethora of qualified OpenFlow hardware.

ControlTower is our innovative platform for distributed visibility launched nearly two years ago. This solution manages a cluster of our Net Tool Optimizers (NTOs) as if you were managing a single logical NTO. At the time of its launch, we leveraged Software Defined Networking (SDN) concepts to achieve powerful distributed monitoring for data centers and campus networks. The drag and drop GUI, advanced packet processing, and patented filter compiler allow multiple users to manage and optimize traffic across the cluster without interfering with each other. We had great response from customers to the ControlTower concept; they loved how we took very complex routing and rules calculation problems and boiled them down to an easy-to-use, single-pane-of-glass GUI (or API) even when spanning across multiple NTOs.

Our announcement takes ControlTower one giant leap further by allowing qualified OpenFlow switches to become members of a ControlTower cluster, incorporating them under one powerful and simple management console, extending powerful network visibility capabilities throughout the data center. You don’t need to be an OpenFlow expert, just hook up your OpenFlow switches and we take care of the complicated management. You get all the benefits of our straightforward GUI and advanced features for the entire cluster.

We heard from many customers that scalable, cost-effective network visibility is critical to operating a secure and high performance data center. They need analytics tools that access any segment of the network quickly and easily. Monitored traffic must be filtered and optimized to ensure tools are used efficiently. Customers need to focus on optimizing application performance and heading off security issues in every part of their data center, not managing switch ACL’s, CLI’s, forwarding rulesets, interconnects, etc.

Ixia responded by enhancing ControlTower to recognize OpenFlow devices, allowing customers to scale our powerful visibility features across hundreds of OpenFlow ports. Today, ControlTower is qualified to work with HP, Dell, and Arista OpenFlow switches—and we will expand the list further in the future.

This addition to the ControlTower platform is exciting for several reasons:

  • The powerful advanced features of ControlTower can now be applied across more of your network for greater visibility.
  • You don’t need to be conversant in OpenFlow or deploy an SDN controller, we take care of all the complexity in managing the OpenFlow switches. Just hook them up and our clever software takes control of the configuration details.
  • We provide RESTful API for integration with automation.
  • You can apply features such as Dynamic Filters, Packet Deduplication, ATIP (Application Threat Intelligence Processor), TimeStamping, Packet Trimming, and Traffic Shaping to any traffic in the cluster.
  • OpenFlow is ubiquitous with Ethernet switch vendors, presenting tremendous range of deployment options
  • OpenFlow helps future proof your visibility architecture by incorporating future developments in speed, density and capacity.
  • You have the flexibility to share precious switching hardware and rack space between production and visibility networks.
  • You can easily partition a switch, with some OpenFlow ports for network visibility and some ports for normal production traffic. The production partition doesn’t even need to run OpenFlow, it can be a basic L2 Ethernet switch!
  • You can easily provision more visibility ports dynamically as your network expands or changes.
  • Ixia’s extensive OpenFlow expertise enabled us to make this advancement. Ixia was first in the testing of OpenFlow technologies with our IxNetwork product several years ago, and we have been very active in development of the OpenFlow standard.

Customers who have seen this new feature set have been very excited. ControlTower’s OpenFlow capabilities will help them reach all the corners of their data center, and provide a new flexibility to deploy network resources how they wish with all benefits of an end-to-end Network Visibility Architecture.

Additional Resources:

NTO ControlTower

Network Visibility Architecture

Thanks to Ixia for the article.

Visibility Architectures Enable Real-Time Network Vigilance

Ixia's Network Visibility Architecture

A couple of weeks ago, I wrote a blog on how to use a network lifecycle approach to improve your network security. I wanted to come back and revisit this as I’ve had a few people ask me why the visibility architecture is so important. They had (incorrectly, IMO) been told by others to just focus on the security architecture and everything else would work out fine.

The reason you need a visibility architecture in place is because if you are attacked, or breached, how will you know? During a DDoS attack you will most likely know because of website performance problems, but most for most of the other attacks how will you know?

This is actually a common problem. The 2014 Trustwave Global Security Report stated that 71% of compromised victims did not detect the breach themselves—they had no idea and attack had happened. The report also went on to say that the median number of days from initial intrusion to detection was 87! So most companies never detected the breach on their own (they had to be told by law enforcement, a supplier, customer, or someone else), and it took almost 3 months after the breach for that notification to happen. This doesn’t sound like the optimum way to handle network security to me.

The second benefit of a visibility architecture is faster remediation once you discover that you have been breached. In fact, some Ixia customers have seen an up to 80% reduction in their mean time to repair performance due to implementing a proper visibility architecture. If you can’t see the threat, how are you going to respond to it?

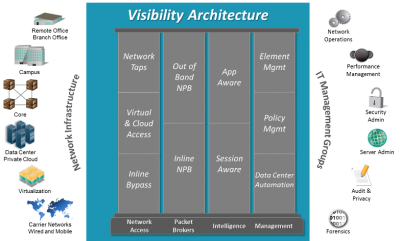
A visibility architecture is the way to solve these problems. Once you combine the security architecture with the visibility architecture, you equip yourself with the necessary tools to properly visualize and diagnose the problems on your network. But what is a visibility architecture? It’s a set of components and practices that allow you to “see” and understand what is happening in your network.

The basis of a visibility architecture starts with creating a plan. Instead of just adding components as you need them at sporadic intervals (i.e., crisis points), step back and take a larger view of where you are and what you want to achieve. This one simple act will save you time, money and energy in the long run.

Ixia's Network Visibility Architecture

The actual architecture starts with network access points. These can be either taps or SPAN ports. Taps are traditionally better because they don’t have the time delays, summarized data, duplicated data, and the hackability that are inherent within SPAN ports. However, there is a problem if you try to connect monitoring tools directly to a tap. Those tools become flooded with too much data which overloads them, causing packet loss and CPU overload. It’s basically like drinking from a fire hose for the monitoring tools.

This is where the next level of visibility solutions, network packet brokers, enter the scene. A network packet broker (also called an NPB, packet broker, or monitoring switch) can be extremely useful. These devices filter traffic to send only the right data to the right tool. Packets are filtered at the layer 2 through layer 4 level. Duplicate packets can also be removed and sensitive content stripped before the data is sent to the monitoring tools if that is required as well. This then provides a better solution to improve the efficiency and utility of your monitoring tools.

Access and NPB products form the infrastructure part of the visibility architecture, and focus on layer 2 through 4 of the OSI model. After this are the components that make up the application intelligence layer of a visibility architecture, providing application-aware and session-aware visibility. This capability allows filtering and analysis further up the stack at the application layer, (layer 7). This is only available in certain NPBs. Depending upon your needs, it can be quite useful as you can collect the following information:

  • Types of applications running on your network
  • Bandwidth each application is consuming
  • Geolocation of application usage
  • Device types and browsers in use on your network
  • Filter data to monitoring tools based upon the application type

These capabilities can give you quick access to information about your network and help to maximize the efficiency of your tools.

These layer 7 application oriented components provide high-value contextual information about what is happening with your network. For example, this type of information can be used to generate the following benefits:

  • Maximize the efficiency of current monitoring tools to reduce costs
  • Gather rich data about users and applications to offer a better Quality of Experience for users
  • Provide fast, easy to use capabilities to spot check for security & performance problems

Ixia's Network Visibility Architecture

And then, of course, there are the management components that provide control of the entire visibility architecture: everything from global element management, to policy and configuration management, to data center automation and orchestration management. Engineering flexible management for network components will be a determining factor in how well your network scales.

Visibility is critical to this third stage (the production network) of your network’s security lifecycle that I referred to in my last blog. (You can view a webinar on this topic if you want.) This phase enables the real-time vigilance you will need to keep your network protected.

As part of your visibility architecture plan, you should investigate and be able to answer these three questions.

  1. Do you want to be proactive and aggressively stop attacks in real-time?
  2. Do you actually have the personnel and budget to be proactive?
  3. Do you have a “honey pot” in place to study attacks?

Depending upon those answers, you will have the design of your visibility architecture. As you can see from the list below, there are several different options that can be included in your visibility architecture.

  • In-line components
  • Out-of-band components
  • Physical and virtual data center components
  • Layer 7 application filtering
  • Packet broker automation
  • Monitoring tools

In-line and/or out-of-band security and monitoring components will be your first big decision. Hopefully everybody is familiar with in-line monitoring solutions. In case you aren’t, an in-line (also called bypass) tap is placed in-line in the network to allow access for security and monitoring tools. It should be placed after the firewall but before any equipment. The advantage of this location is that should a threat make it past the firewall, that threat can be immediately diverted or stopped before it has a chance to compromise the network. The tap also needs to have heartbeat capability and the ability to fail closed so that should any problems occur with the device, no data is lost downstream. After the tap, a packet broker can be installed to help traffic to the tools. Some taps have this capability integrated into them. Depending upon your need, you may also want to investigate taps that support High Availability options if the devices are placed into mission critical locations. After that, a device (like an IPS) is inserted into the network.

In-line solutions are great, but they aren’t for everyone. Some IT departments just don’t have enough personnel and capabilities to properly use them. But if you do, these solutions allow you to observe and react to anomalies and problems in real-time. This means you can stop an attack right away or divert it to a honeypot for further study.

The next monitoring solution is an out-of-band configuration. These solutions are located further downstream within the network than the in-line solutions. The main purpose of this type of solution is to capture data post event. Depending whether interfaces are automated or not, it is possible to achieve near real-time capabilities—but they won’t be completely real-time like the in-line solutions are.

Nevertheless, out-of-band solutions have some distinct and useful capabilities. The solutions are typically less risky, less complicated, and less expensive than in-line solutions. Another benefit of this solution is that it gives your monitoring tools more analysis time. Data recorders can capture information and then send that information to forensic, malware and/or log management tools for further analysis.

Do you need to consider monitoring for your virtual environments as well as your physical ones? Virtual taps are an easy way to gain access to vital visibility information in the virtual data center. Once you have the data, you can forward it on to a network packet broker and then on to the proper monitoring tools. The key here is apply “consistent” policies for your virtual and physical environments. This allows for consistent monitoring policies, better troubleshooting of problems, and better trending and performance information.

Other considerations are whether you want to take advantage of automation capabilities, and do you need layer 7 application information? Most monitoring solutions only deliver layer 2 through 4 packet data, so layer 7 data could be very useful (depending upon your needs).

Application intelligence can be a very powerful tool. This tool allows you to actually see application usage on a per-country, per-state, and per-neighborhood basis. This gives you the ability to observe suspicious activities. For instance, maybe an FTP server is sending lots of files from the corporate office to North Korea or Eastern Europe—and you don’t have any operations in those geographies. The application intelligence functionality lets you see this in real time. It won’t solve the problem for you, but it will let you know that the potential issue exists so that you can make the decision as to what you want to do.

Another example is that you can conduct an audit for security policy infractions. For instance, maybe your stated process is for employees to use Outlook for email. You’ve then installed anti-malware software on a server to inspect all incoming attachments before they are passed onto users. With an application intelligence product, you can actually see if users are connecting to other services (maybe Gmail or Dropbox) and downloading files through that application. This practice would bypass your standard process and potentially introduce a security risk to your network. Application intelligence can also help identify compromised devices and malicious botnet activities through Command and Control communications.

Automation capability allows network packet brokers to be automated to initiate functions (e.g., apply filters, add connections to more tools, etc.) in response to external commands. This automation allows a switch/controller to make real-time adjustments to suspicious activities or problems within the data network. The source of the command could be a network management system (NMS), provisioning system, security information and event management (SIEM) tool or some other management tool on your network that interacts with the NPB.

Automation for network monitoring will become critical over the next several years, especially as more of the data center is automated. The reasons for this are plain: how do you monitor your whole network at one time? How do you make it scale? You use automation capabilities to perform this scaling for you and provide near real-time response capabilities for your network security architecture.

Finally, you need to pick the right monitoring tools to support your security and performance needs. This obviously depends the data you need and want to analyze.

The life-cycle view discussed previously provides a cohesive architecture that can maximize the benefits of visibility like the following:

  • Decrease MTTR up to 80% with faster analysis of problems
  • Monitor your network for performance trends and issues
  • Improve network and monitoring tool efficiencies
  • Application filtering can save bandwidth and tool processing cycles
  • Automation capabilities, which can provide a faster response to anomalies without user administration
  • Scale network tools faster

Once you integrate your security and visibility architectures, you will be able to optimize your network in the following ways:

  • Better data to analyze security threats
  • Better operational response capabilities against attacks
  • The application of consistent monitoring and security policies

Remember, the key is that by integrating the two architectures you’ll be able to improve your root cause analysis. This is not just for security problems but all network anomalies and issues that you encounter.

Additional Resources

  • Network Life-cycle eBook – How to Secure Your Network Through Its Life Cycle
  • Network Life-cycle webinar – Transforming Network Security with a Life-Cycle Approach
  • Visibility Architecture Security whitepaper – The Real Secret to Securing Your Network
  • Security Architecture whitepaper – How to Maximize IT Investments with Data-Driven Proof of Concept (POC)
  • Security solution overview – A Solution to Network Security That Actually Works
  • Cyber Range whitepaper – Accelerating the Deployment of the Evolved Cyber Range

Thanks to Ixia for the article. 

Optimizing Networks with Ixia

Ixia's Visibility Architecture

We work with more than 40 of the top 50 carriers worldwide, as well as many of their largest customers and the companies who provide infrastructure technology for their networks. We’re the “application performance and security resilience” company – we help you make sure technology works the way you expect it to out of the gate, and keeps on doing it throughout the deployment lifecycle.

Today’s mobile subscribers are what we call “tough customers”: they expect instant availability and high performance, all the time, everywhere they go, and they tend to remember the “hiccups” more than all the times everything works just fine. No one has patience for dropped calls or choppy video or slow downloads anymore.

And that’s where Ixia comes in. We helps carriers and other providers worldwide exceed the expectations of their toughest customers. Physical or virtualized, wired or wireless, we can help you build and validate, secure, and optimize networks that deliver.

We do this with powerful and versatile hardware and software solutions, expert global support, and professional services, all designed to ensure user satisfaction and a great bottom line.

So what does this mean to you?

The Growing Performance Challenge

Right now we’re going to talk about optimizing your network and security over time—after you’ve validated and deployed new technologies and services.

  • How do you maintain quality with more mobile devices connecting to more data from more sources?
  • How do you manage and help customers manage the impact of the “BYOD” trend?
  • How you monitor the performance of VNFs in a newly virtualized environment?

These and other challenges are complicated by customers’ high expectations for always-on access and immediate application response. Not to mention new “blind spots” created by virtualization and the growing complexity of networks.

Today’s monitoring systems can quickly become stressed, making it harder to keep up with traffic and filter data to the appropriate tools. Optimizing the network requires 100% visibility into traffic along with real-time intelligence.

During the operations phase of the technology lifecycle, companies are looking to obtain actionable insight into performance, and maintain seamless application delivery. More intelligence –and sometimes more advanced tools –are needed to maximize visibility, and maximize the value of existing investments.

To meet both business and technology goals requires a highly scalable visibility architecture like Ixia’s to eliminate blind spots, and add control without adding complexity.

Example

One leading European bank with more than 13 million customers, 5,000 branches, and 9,000 ATMs needed to upgrade its infrastructure to meet new internal compliance standards. The company was also upgrading data centers to 40GbE, and looking to integrate the new links with the current traffic monitoring systems.

Ixia’s Net Tool Optimizer solutions made for an easy transition. The NTO family of network packet brokers or “NPBs” –are we sure we have enough acronyms? – helped connect the new 40GbE links to their monitoring system with no downtime, and helped them meet the new compliance requirements while providing for future growth.

Benefits included reducing the load on existing monitoring tools by more than 40%. Pretty powerful stuff.

Ixia Difference

So what is the Ixia Visibility Architecture? Basically it’s the sum total of the industry’s most comprehensive product portfolio.

This includes the NPBs we just talked about that aggregate and filter traffic to monitoring tools, as well as “taps” that provide visibility into any network link, and virtualized taps or vTaps that eliminate new blind spots created during virtualization.

The Ixia portfolio delivers 100% visibility and into the network at speeds up to 100Gbps. No matter what type of traffic you’re running – games, online banking, video streaming, online shopping, automotive Ethernet, and the like – application traffic IS the network, and Ixia visibility solutions help optimize the customer experience in real time, and over time.

Additional Resources:

Ixia visibility solutions

Ixia NTO solutions

Ixia Net Optics taps

Thanks to Ixia for the article.

Ixia Extends Visibility Architecture with Native OpenFlow Integration

Network Visibility Solutions

Ixia (Nasdaq: XXIA), a leading provider of application performance and security resilience solutions, announced an update to its ControlTower distributed network visibility platform that includes support for OpenFlow enabled switches from industry leading manufacturers. ControlTower OpenFlow support has at present been interoperability tested with Arista, Dell and HP OpenFlow enabled switches.

“Dell is a leading advocate for standards such as Openflow on our switching platforms to enable rich and innovative networking applications,” said Arpit Joshipura, Vice President, Dell Networking. “With Ixia choosing to support our Dell Networking switches within its ControlTower management framework, Dell can extend cost-effective visibility and our world-class services to our enterprise customers.”

Ixia’s enhanced ControlTower platform takes a unique open-standards based approach to significantly increase scale and flexibility for network visibility deployments. The new integration makes ControlTower the most extensible visibility solution on the market. This allows customers to leverage SDN and seamlessly layer the sophisticated management and advanced processing features of Ixia’s Net Tool Optimizer® (NTO) family of solutions on top of the flexibility and baseline feature set provided by OpenFlow switches.

“Data centers benefit from the power and flexibility that OpenFlow switches can provide but cannot afford to lose network visibility,” said Shamus McGillicuddy, Senior Analyst, Network Management at Enterprise Management Associates. “However organizations can use these same SDN-enabled switches with a visibility architecture to ensure that their existing monitoring and performance management tools can maintain visibility.”

Key highlights of the expanded visibility architecture include:

  • Ease of use, advanced processing functions and single pane of glass configuration through Ixia’s NTO user interface and purpose-built hardware
  • Full programmability and automation control using RESTful APIs
  • Patented automatic filter compiler engine for hassle-free visibility
  • Architectural support for line speeds from 1Gbps to 100Gbps in a highly scalable design
  • Open, standards-based integration with the flexibility to use a variety of OpenFlow enabled hardware and virtual switch platforms
  • Dynamic repartitioning of switch ports between production switching and visibility enablement to optimize infrastructure utilization

“This next-generation ControlTower delivers solutions that leverage open standards to pair Ixia’s field-proven visibility architecture with best of breed switching, monitoring and security platforms,” added Deepesh Arora, Vice President of Product Management at Ixia. These solutions will provide our customers the flexibility needed to access, aggregate and manage their business-critical networks for the highest levels of application performance and security resilience.”

About Ixia’s Visibility Architecture

Ixia’s Visibility Architecture helps companies achieve end-to-end visibility and security in their physical and virtual networks by providing their tools with access to any point in the network. Regardless of network scale or management needs, Ixia’s Visibility Architecture delivers the control and simplicity necessary to improve the usefulness of these tools.

Thanks to Ixia for the article.

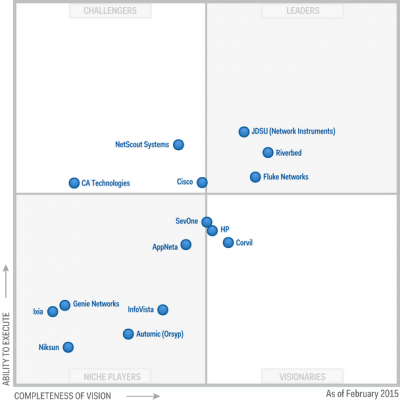
Magic Quadrant for Network Performance Monitoring and Diagnostics

Magic Quadrant for Network Performance Monitoring and Diagnostics

Network professionals support an increasing number of technologies and services. With adoption of SDN and network function virtualization, troubleshooting becomes more complex. Identify the right NPMD tools to detect application issues, identify root causes and perform capacity planning.

Market Definition/Description

Network performance monitoring and diagnostics (NPMD) enable network professionals to understand the impact of network behavior on application and infrastructure performance, and conversely, via network instrumentation. Other users and use cases exist, especially because these tools provide insight into the quality of the end-user experience. The goal of NPMD products is not only to monitor network components to facilitate outage and degradation resolution, but also to identify performance optimization opportunities. This is conducted via diagnostics, analytics and debugging capabilities to complement additional monitoring of today’s complex IT environments. At an estimated $1.1 billion, the NPMD market is a fast-growing segment of the larger network management space ($1.9 billion in 2013), and overlaps slightly with aspects of the application performance monitoring (APM) space ($2.4 billion in 2013).

Magic Quadrant

Magic Quadrant for Network Performance Monitoring and Diagnostics

Vendor Strengths and Cautions- Highlights

Ixia

Ixia was founded in 1997, specializing in network testing. Ixia entered the NPMD market through acquisition of Net Optics in 2013 and its Spyke monitoring product. The tool is aimed at small or midsize businesses (SMBs), although it can support gigabit and 10G environments. The Spyke tool has been subject to an end of life (EOL) announcement, with end of sale (EOS) beginning 31 October 2014, and EOL beginning 31 October 2017.

Given Ixia’s focus on the network packet broker (NPB) space, it can cover NPMD and NPB use cases, something only a few other vendors can claim. Ixia launched a new NPB platform, the Network Tool Optimizer (NTO) 7300 in 1H14, which provides large-scale chassis design and additional modules that help offload some NPMD capabilities. The goal of these modules is optimal use of the existing end-user NPMD tool. Modules include Ixia Packet Capture Module (PCM) with 14GB of triggered packet capture at 40GbE line rates and 48 ports of NPB, and the Ixia Application and Threat Intelligence (ATI) Processor, which provides extensive processing power in addition to 48 ports of NBP. The ATI Processor requires a subscription at an additional recurring cost. The new 7300 product and platform has no current Gartner-verified customer references. Fundamental VoIP, application visibility and end-user experience metrics are standard capabilities. While the tool provides packet inspection and application visibility, product updates have not been observed for some time and the road map remains unclear.

Ixia’s NPMD revenue is between $5 million and $10 million per year. Ixia did not respond to requests for supplemental information and/or to review the draft contents of this document. Gartner’s analysis for this vendor is therefore based on other credible sources, including previous vendor briefings and interactions, the vendor’s own marketing collateral, public information and discussions with more than 200 end users who either have evaluated or deployed each NPMD product.

Strengths

  • Ixia’s ATI Processor provides visibility of, and rules to classify, traffic based on application types and performance of applications.
  • Ixia has significant R&D resources. Of the 1,800 staff, more than 800 are engineering- and R&D-focused.
  • Ixia’s market leadership in NPB allows it to leverage scalable hardware design with software capabilities to enable NPMD and additional troubleshooting needs by offloading some of these requirements from other more comprehensive NPMD tools.

Cautions

  • With the EOS of the Spyke and Net Optics appTap platforms, Ixia appears to have discontinued investments in pure NPMD capabilities.
  • Since the launch of the NTO 7300 platform in early 2014, there has been limited traction due to existing NPB investments and high cost for the hardware buy-in.
  • Financial reporting restatements and filing delays, combined with the resignation of two senior corporate officers, may hinder overall strategic focus and vision.

JDSU (Network Instruments)

In 2014, we have witnessed the completion of JDSU’s acquisition of Network Instruments, its subsequent integration into JDSU’s Network and Service Enablement business segment, the recent release of updates to its NPMD offering, and announced plans to separate JDSU into two entities in 2015. While this action could provide additional efficiencies and focus in the future, the preceding business integration and sales enablement efforts are only now beginning to bear fruit and will have to shift once more in response to the coming changes. The Network Instruments unit has followed a well-established, vertically integrated technology development strategy, designing and manufacturing most of its product components and software. An OEM relationship with CA Technologies, which had Network Instruments providing its GigaStor products to CA customers, devolved into a referral relationship, but no meaningful challenges have been voiced by Gartner clients as a result of this. Two key parts of the NPMD solution have new product names (Observer Apex and Observer Management Server) and a new, modern UI that is a significant improvement. Network Instruments’ current NPMD solution set is now part of the Observer Performance Management Platform 17, and includes Observer Apex, Observer Analyzer, Observer Management Server, Observer GigaStor, Observer Probes and Observer Infrastructure (v.4.2).

JDSU’s (Network Instruments) NPMD revenue is between $51 million and $150 million per year.

Strengths

  • Data- and process-level integration workflows are well-thought-out across the solution’s component products.
  • Network Instruments’ recent addition of a network packet broker product (Observer Matrix) to its offerings may appeal to small-scale enterprises looking for NPMD and NPB capabilities from the same vendor.
  • Packet capture and inspection capability (via GigaStor) is well-regarded by clients.

Cautions

  • While significant business integration activities have not, to date, had a perceptible impact on support or development productivity, this process is ongoing and now part of a larger business separation action that could result in challenges in the near future.
  • The NPMD solution requires multiple components with differing user interfaces that are not consistent across products.
  • The solution is focused on physical appliances, with limited options beyond proprietary hardware.

To learn more, download the full report here

Thanks to Gartner for the article. 

Virtualization Gets Real

Optimizing NFV in Wireless Networks

The promise of virtualization looms large: greater ability to fast-track services with lower costs, and, ultimately, less complexity. As virtualization evolves to encompass network functions and more, service delivery will increasingly benefit from using a common virtual compute and storage infrastructure.

Ultimately, providers will realize:

Lower total cost of ownership (TCO) by replacing dedicated appliances with commodity hardware and software-based control.

Greater service agility and scalability with functions stitched together into dynamic, highly efficient “service chains” in which each function follows the most appropriate and cost-effective path.

Wired and wireless network convergence as the 2 increasingly share converged networks, virtualized billing, signaling, security functions, and other common underlying elements of provisioning. Management and orchestration (M&O) and handoffs between infrastructures will become more seamless as protocol gateways and other systems and devices migrate to the cloud;

On-the-fly self-provisioning with end users empowered to change services, add features, enable security options, and tweak billing plans in near real-time.

At the end of the day, sharing a common pool of hardware and flexibly allocated resources will deliver far greater efficiency, regardless of what functions are being run and the services being delivered. But the challenges inherent in moving vital networking functions to the cloud loom even larger than the promise, and are quickly becoming real.

The Lifecycle NFV Challenge: Through and Beyond Hybrid Networks

Just 2 years after a European Telecommunications Standards Institute (ETSI) Industry Specification Groups (ISG) outlined the concept, carriers worldwide are moving from basic proof of concept (PoC) demonstrations in the lab to serious field trials of Network Functions Virtualization (NFV). Doing so means making sure new devices and unproven techniques deliver the same (or better) performance when deployments go live.

The risks of not doing so — lost revenues, lagging reputations, churn — are enough to prompt operators to take things in stages. Most will look to virtualize the “low-hanging fruit” first.

Devices like firewalls, broadband remote access servers (BRAS), policy servers, IMS components, and customer premises equipment (CPE) make ideal candidates for quickly lowering CapEx and OpEx without tackling huge real-time processing requirements. Core routing and switching functions responsible for data plane traffic will follow as NFV matures and performance increases.

In the meantime, hybrid networks will be a reality for years to come, potentially adding complexity and even cost (redundant systems, additional licenses) near-term. Operators need to ask key questions, and adopt new techniques for answering them, in order to benefit sooner rather than later.

To thoroughly test virtualization, testing itself must partly become virtualized. Working in tandem with traditional strategies throughout the migration life cycle, new virtualized test approaches help providers explore these 4 key questions:

1. What to virtualize and when? To find this answer, operators need to baseline the performance of existing networks functions, and develop realistic goals for the virtualized deployment. New and traditional methods can be used to measure and model quality and new configurations.

2. How do we get it to work? During development and quality assurance, virtualized test capabilities should be used to speed and streamline testing. Multiple engineers need to be able to instantiate and evaluate virtual machines (VMs) on demand, and at the same time.

3. Will it scale? Here, traditional testing is needed, with powerful hardware systems used to simulate high-scale traffic conditions and session rates. Extreme precision and load aid in emulating real-world capacity to gauge elasticity as well as performance.

4. Will it perform in the real world? The performance of newly virtualized network functions (VNFs) must be demonstrated on its own, and in the context of the overall architecture and end-to-end services. New infrastructure components such as hypervisors and virtual switches (vSwitches) need to be fully assessed and their vulnerability minimized.

Avoiding New Bottlenecks and Blind Spots

Each layer of the new architectural model has the potential to compromise performance. In sourcing new devices and devising techniques, several aspects should be explored at each level:

At the hardware layer, server features and performance characteristics will vary from vendor to vendor. Driver-level bottlenecks can be caused by routine aspects such as CPU and memory read/writes.

With more than 1 type of server platform often in play, testing must be conducted to ensure consistent and predictable performance as Virtual Machines (VMs) are deployed and moved from one type of server to another. The performance level of NICs can make or break the entire system as well, with performance dramatically impacted by simply not having the most recent interfaces or drivers.

Virtual switches and implementations vary greatly, with some coming packaged with hypervisors and others functioning standalone. vSwitches may also vary from hypervisor to hypervisor, with some favoring proprietary technology while others leverage open source. Finally, functionality varies widely with some providing very basic L2 bridge functionality and others acting as full-blown virtual routers.

In comparing and evaluating vSwitch options, operators need to weigh performance, throughput, and functionality against utilization. During provisioning, careful attention must also be given to resource allocation and the tuning of the system to accommodate the intended workload (data plane, control plane, signaling).

Moving up the stack, hypervisors deliver virtual access to underlying compute resources, enabling features like fast start/stop of VMs, snapshot, and VM migration. Hypervisors allow virtual resources (memory, CPU, and the like) to be strictly provisioned to each VM, and enable consolidation of physical servers onto a virtual stack on a single server.

Again, operators have multiple choices. Commercial products may offer more advanced features, while open source alternatives have the broader support of the NFV community. In making their selection, operators should evaluate both the overall performance of each potential hypervisor, and the requirements and impact of its unique feature set.

Management and Orchestration is undergoing a profound fundamental shift from managing physical boxes to managing virtualized functionality. Increased automation is required as this layer must interact with both virtualized server and network infrastructures, often using OpenStack protocols, and in many cases SDN.

VMs and VNFs themselves ultimately impact performance as each requires virtualized resources (memory, storage, and vNICs), and involves a certain number of I/O interfaces. In deploying a VM, it must be verified that the host OS is compatible with the hypervisor. For each VNF, operators need to know which hypervisors the VMs have been verified on, and assess the ability of the host OS to talk to both virtual I/O and the physical layer. The ultimate portability, or ability of a VM to be moved between servers, must also be demonstrated.

Once deployments go live, other overarching aspects of performance, like security, need to be safeguarded. With so much now occurring on a single server, migration to the cloud introduces some formidable new visibility challenges that must be dealt with from start to finish:

Pinpointing performance issues grows more difficult. Boundaries may blur between hypervisors, vSwitches, and even VMs themselves. The inability to source issues can quickly give way to finger pointing that wastes valuable time.

New blind spots also arise. In a traditional environment, traffic is visible on the wire connected to the monitoring tools of choice. Inter-VM traffic within virtualized servers, however, is managed by the hypervisor’s vSwitch, without traversing the physical wire visible to monitoring tools. Traditional security and performance monitoring tools can’t see above the vSwitch, where “east-west” traffic now flows between guest VMs. This newly created gap in visibility may attract intruders and mask pressing performance issues.

Monitoring tool requirements increase as tools tasked with filtering data at rates for which they were not designed quickly become overburdened.

Audit trails may be disrupted, making documenting compliance with industry regulations more difficult, and increasing the risk of incurring fines and bad publicity.

To overcome these emerging obstacles, a new virtual visibility architecture is evolving. As with lab testing, physical and virtual approaches to monitoring live networks are now needed to achieve 100% visibility, replicate field issues, and maintain defenses. New virtualized monitoring Taps (vTaps) add the visibility into inter-VM traffic that traditional tools don’t deliver.

From There On…

The bottom line is that the road to the virtualization of the network will be a long one, without a clear end and filled with potential detours and unforeseeable delays. But with the industry as a whole banding together to pave the way, NFV and its counterpart, Software Defined Networking (SDN) represent a paradigm shift the likes of which the industry hasn’t seen since mobilization itself.

As with mobility, virtualization may cycle through some glitches, retrenching, and iterations on its way to becoming the norm. And once again, providers who embrace the change, validating the core concepts and measuring success each step of the way will benefit most (as well as first), setting themselves up to innovate, lead, and deliver for decades to come.

Thanks to OSP for the article