The Top 3 Reasons Why Network Discovery is Critical to IT Success

Network discovery is the process of identifying devices attached to a network. It establishes the current state and health of your IT infrastructure.

It’s essential for every business due to the fact that without the visibility into your entire environment you can’t successfully accomplish even the basics of network management tasks.

When looking into why Network Discovery is critical to IT success there are three key factors to take into consideration.

1. Discovering the Current State & Health of the Infrastructure.

Understanding the current state and health of the network infrastructure is a fundamental requirement in any infrastructure management environment. What you cannot see you cannot manage, or even understand, so it is vital for infrastructure stability to have a tool that can constantly discover the state and health of the components in operation.

2. Manage & Control the Infrastructure Environment

  • Once you know what you have its very easy to compile an accurate inventory of the following:
  • The environment’s components provide the ability to track hardware.
  • To manage end-of-life and end‑of‑support.
  • The hardware threshold management (i.e. Swap-Out device before failure)
  • To effectively manage the estates operating systems and patch management.

3. Automate Deployment

Corporation’s today place a lot of emphasis on automation therefore, it is very important that when choosing a Network Discovery tool to operate your infrastructure environment, it can integrate seamlessly with your CRM system. Having a consistent view of the infrastructure inventory and services will allow repeatable and consistent deployment of hardware and configuration in order to automate service fulfillment and deployment.

If you’re not using network discovery tool don’t worry were offering the service for absolutely free, just click below and you will be one step closer to improving your network management system.

The Top 3 Reasons Why Network Discovery is Critical to IT Success

Thanks to NMSaaS for the article. 

CVE-2015-5119 and the Value of Security Research and Ethical Disclosure

The Hacking Team’s Adobe Flash zero day exploit CVE-2015-5119, as well as other exploits, were recently disclosed.

Hacking Team sells various exploit and surveillance software to government and law enforcement agencies around the world. In order to keep their exploits working as long as possible, Hacking Team does not disclose their exploits. As such, the vulnerabilities remain open until they are discovered by some other researcher or hacker and disclosed.

This particular exploit is a fairly standard, easily weaponizable use-after-free—a type of exploit which accesses a pointer that points to already free and likely changed memory, allowing for the diversion of program flow, and potentially the execution of arbitrary code. At the time of this writing, the weaponized exploits are known to be public.

What makes this particular set of exploits interesting is less how they work and what they are capable of (not that the damage they are able to do should be downplayed: CVE-2015-5119 is capable of gaining administrative shell on the target machine), but rather the nature of their disclosure.

This highlights the importance of both security research and ethical disclosure. In a typical ethical disclosure, the researcher contacts the developer of the vulnerable product, discloses the vulnerability, and may even work with the developer to fix it. Once the product is fixed and the patch enters distribution, the details may be disclosed publically, which can be useful learning tools for other researchers and developers, as well as for signature development and other security monitoring processes. Ethical disclosure serves to make products and security devices better.

Likewise, security research itself is important. Without security research, ethical disclosure isn’t an option. While there is no guarantee that the researchers will find the exact vulnerabilities held secret by the likes of Hacking Team, the probability goes up as the number and quality of researches increases. Various incentives exist, from credit given by the companies and on vulnerability databases, to bug bounties, some of which are quite substantial (for instance, Facebook has awarded bounties as high as $33,500 at the time of this writing).

However some researchers, especially independent researchers, may be somewhat hesitant to disclose vulnerabilities, as there have been past cases where rather than being encouraged for their efforts, they instead faced legal repercussions. This unfortunately discourages security research, allowing for malicious use of exploits to go unchecked in these areas.

Even in events such as the sudden disclosure of Hacking Team’s exploits, security research was again essential. Almost immediately, the vendors affected began patching their software, and various security researchers developed penetration test tools, IDS signatures, and various other pieces of security related software as a response to the newly disclosed vulnerabilities.

Security research and ethical disclosure practices are tremendously beneficial for a more secure Internet. Continued use and encouragement of the practice can help keep our networks safe. Ixia’s ATI subscription program, which is releasing updates that mitigate the damage the Hacking Team’s now-public exploits can do, helps keep network security resilience at its highest level.

Additional Resources:

ATI subscription

Malwarebytes UnPacked: Hacking Team Leak Exposes New Flash Player Zero Day

Thanks to Ixia for the article

3 Steps to Configure Your Network For Optimal Discovery

All good network monitoring / management begins the same way – with an accurate inventory of the devices you wish to monitor. These systems must be on boarded into the monitoring platform so that it can do its job of collecting KPI’s, backing up configurations and so on. This onboarding process is almost always initiated through a discovery process.

This discovery is carried out by the monitoring system and is targeted at the devices on the network. The method of targeting may vary, from a simple list of IP addresses or host names, to a full subnet discovery sweep, or even by using an exported csv file from another system. However, the primary means of discovery is usually the same for all Network devices, SNMP.

Additional means of onboarding can (and certainly do) exist, but I have yet to see any full-featured management system that does not use SNMP as one of its primary foundations.

SNMP has been around for a long time, and is well understood and (mostly) well implemented in all major networking vendors’ products. Unfortunately, I can tell you from years of experience that many networks are not optimally configured to make use of SNMP and other important configuration options which when setup correctly will optimize the network for a more efficient and ultimately more successful discovery and onboarding process.

Having said that, below are 3 simple steps that should be taken, in order to help maximize your network for optimal discovery.

1) Enable SNMP

Yes it seems obvious to say that if SNMP isn’t enabled then it will not work. But, as mentioned before it still astonishes me how many organizations I work with that still do not have SNMP enabled on all of the devices they should have. These days almost any device that can connect to a network usually has some SNMP support built in. Most networks have SNMP enabled on the “core” devices like Routers / Switches / Servers, but many IT pros many not realize that SNMP is available on non- core systems as well.

Devices like VoIP phones and video conferencing systems, IP connected security cameras, Point of Sale terminals and even mobile devices (via apps) can support SNMP. By enabling SNMP on as many possible systems in the network, the ability to extend the reach of discovery and monitoring has grown incredibly and now gives visibility into the network end-points like never before.

2) Setup SNMP correctly

Just enabling SNMP isn’t enough – the next step is to make sure it is configured correctly. That means removing / changing the default Read Only (RO) community string (which is commonly set by default to “public”) to a more secure string. It is also best practice to use as few community strings as you can. In many large organizations, there can be some “turf wars” over who gets to set these strings on systems. The Server team may have one standard string and the network team has another.

Even though most systems will allow for multiple strings, it is generally best to try to keep these as consistent as possible. This helps prevent confusion when setting up new systems and also helps eliminate unnecessary discovery overhead on the management systems (which may have to try multiple community strings for each device on an initial discovery run). As always, security is important, so you should configure the IP address of the known management server as an allowed SNMP system and block any other systems from being allowed to run an SNMP query against your systems.

3) Enable Layer 2 discovery protocols

In your network, you want much deeper insight into not only what you have, but how it is all connected. One of the best way to get this information is to enable layer 2 (link layer) discovery abilities. Depending on the vendor(s) you have in your network, this may accomplished with a proprietary protocol like the Cisco Discovery Protocol (CDP) or it may be implemented in a generic standard like the Link Layer Discovery Protocol (LLDP). In either case, by enabling these protocols, you gain valuable L2 connectivity information like connected MAC addresses, VLAN’s, and more.

By following a few simple steps, you can dramatically improve the results of your management system’s onboarding / discovery process and therefore gain deeper and more actionable information about your network.

b2ap3_thumbnail_6313af46-139c-423c-b3d5-01bfcaaf724b.png

Thanks to NMSaaS for the article.

Campus to Cloud Network Visibility

Visibility. Network visibility. Simple terms that are thrown around quite a bit today. But the reality isn’t quite so simple. Why?

Scale for one. It’s simple to maintain visibility for a small network. But large corporate or enterprise networks? That’s another story altogether. Visibility solutions for these large networks have to scale from one end of the network to the other end – from the campus and branch office edge to the data center and/or private cloud. Managing and troubleshooting performance issues demands that we maintain visibility from the user to application and every step or hop in between.

So deploying a visibility architecture or design from campus to cloud requires scale. When I say scale, I mean scale on multiple layers – 5 layers to be exact – product, portfolio, design, management, and support. Let’s look at each one briefly.

Product Scale

Building an end-to-end visibility architecture for an enterprise network requires products that can scale to the total aggregate traffic from across the entire network, and filter that traffic for distribution to the appropriate monitoring and visibility tools. This specifically refers to network packet brokers that can aggregate traffic from 1GE, 10GE, 40GE, and even 100GE links. But it is more than just I/O. These network packet brokers have to have capacity that scales – meaning they have to operate at wire rate – and provide a completely non-blocking architecture whether they exist in a fixed port configuration or a modular- or chassis-based configuration.

Portfolio Scale

Building an end-to-end visibility architecture for an enterprise network also requires a portfolio that can scale. This means a full portfolio selection of network taps, virtual taps, inline bypass switches, out-of-band network packet brokers, inline network packet brokers, and management. Without these necessary components, your designs are limited and your future flexibility is limited.

Design Scale

Building an end-to-end visibility architecture for an enterprise network also requires a set of reference designs or frameworks that can scale. IT organizations expect their partners to provide solutions and not simply product – partners that can provide architectures or design frameworks that solve the most pressing challenges that IT is grappling with on a regular basis.

Management Scale

Building an end-to-end visibility architecture for an enterprise network requires management scale. Management scale is pretty much self-explanatory – a management solution that can manage the entire portfolio of products used in the overall design framework. However, it goes beyond that. Management requires integration. Look for designs that can also integrate easily into existing data center management infrastructures. Look for designs that allow automated service or application provisioning. Automation can really help to provide management scalability.

Support Scale

Building and supporting an end-to-end visibility architecture for an enterprise network requires support services that scale, both in skills sets and geography. Skill sets implies that deployment services and technical support personnel understand more than simply product, but that they understand the environments in which these visibility architectures operate as well. And obviously support services must be 24 x 7 and cover deployments globally.

So, if you’re looking to build an end-to-end visibility solution for your enterprise network, consider the scalability of the solution you’re considering. Consider scale in every sense of the word, not simply product scale. Deploying campus to cloud visibility requires scale from product, to portfolio, to design, to management, to support.

Additional Resources:

Ixia network visibility solutions

Ixia network packet brokers

Thanks to Ixia for the article

Top 10 Key Metrics for NetFlow Monitoring

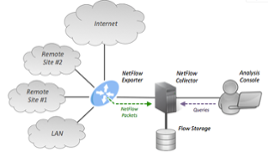
NetFlow is a feature that was introduced on Cisco routers that provides the ability to collect IP network traffic as it enters or exits an interface. By analyzing the data provided by NetFlow, a network administrator can determine things such as the source and destination of traffic, class of service, and the causes of congestion.

There are numerous key metrics when it comes to Netflow Monitoring:

1-Netflow Top Talkers

The flows that are generating the heaviest system traffic are known as the “top talkers.” The NetFlow Top Talkers feature allows flows to be sorted so that they can be viewed, to identify key users of the network.

2-Application Mapping

Application Mapping lets you configure the applications identified by NetFlow. You can add new applications, modify existing ones, or delete them. It’s also usually possible to associate an IP address with an application to help better track applications that are tied to specific servers.

3-Alert profiles

Alert profiles makes network monitoring using NetFlow easier. It allows for the Netflow system to be watching the traffic and alarming on threshold breaches or other traffic behaviors.

4-IP Grouping

You can create IP groups based on IP addresses and/or a combination of port and protocol. IP grouping is useful in tracking departmental bandwidth utilization, calculating bandwidth costs and ensuring appropriate usage of network bandwidth.

5-Netflow Based Security features

NetFlow provides IP flow information in the network. In the field of network security, IP flow information provided by NetFlow is used to analyze anomaly traffic. NetFlow based anomaly traffic analysis is an appropriate supplement to current signature-based NIDS.

6- Top Interfaces

Included in the Netflow Export information is the interface that the traffic passes through. This can be very useful when trying to diagnose network congestion, especially on lower bandwidth WAN interfaces as well as helping to plan capacity upgrades / downgrades for the future.

7- QoS traffic Monitoring

Most networks today enable some level of traffic prioritization. Multimedia traffic like VoIP and Video which are more susceptible to problems when there are network delays typically are tagged as higher priority than other traffic like web and email. Netflow can track which traffic is tagged with these priority levels. This enables network engineers to make sure that the traffic is being tagged appropriately.

8- AS Analysis

Most Netflow tools are able to also show the AS (Autonomous System) number and well known AS assignments for the IP traffic. This can be very useful in peer analysis as well as watching flows across the “border” of a network. For ISP’s and other large organizations this information can be helpful when performing traffic and network engineering analysis especially when the network is being redesigned or expanded.

9- Protocol analysis

One of the most basic metrics that Netflow can provide is a breakdown of TCP/IP protocols in use on the network like TCP, UDP, ICMP etc. This information is typically combined with port and IP address information to provide a complete view of the applications on the network.

10- Extensions with IPFIX

Although technically not NetFlow, IPFIX is fast becoming the preferred method of “flow-based” analysis. This is mainly due to the flexible structure of IPFIX which allows for variable length fields and proprietary vendor information. This is critical when trying to understand deeper level traffic metrics like HTTP host, URLs, messages and more.

Thanks to NMSaaS for the article. 

NTO Now Provides Twice the Network Visibility

Ixia is proud to announce that we are expanding one of the key capabilities in Ixia xStream platforms, “Double Your Ports,” to our Net Tool Optimizers (NTO) family of products. As of our 4.3 release, this capability to double the number of network and monitor inputs is now available on the NTO platform. If you are not familiar with Double Your Ports, it is a feature that allows you to add additional network or tool ports to your existing NTO by allowing different devices to share a single port. For example, if you have used all of the ports on your NTO but want to add a new tap, you can enable Double Your Ports so that a Net Optics Tap and a monitoring tool can share the same port, utilizing both the RX and TX sides of the port. This is how it works:

Standard Mode

In the standard mode, the ports will behave in a normal manner: when there is a link connection on the RX, the TX will operate. When the RX is not connected, the system assumes the TX link is also not connected (down).

Loopback Mode

When you designate a port to be loopback, the data egressing on the TX side will forward directly to the RX side of the same port. This functionality does not require a loopback cable to be plugged into the port. The packets will not transmit outside of the device even if a cable is connected.

Simplex Mode

When you designate a port to be in simplex mode, the port’s TX state is not dependent on the RX state. In the standard mode, when the RX side of the port goes down, the TX side is disabled. If you assign a port mode to simplex, the TX state is up when there is a link on the TX even when there is no link on the RX. You could use a simplex cable to connect a TX of port A to an RX of port B. If port A is in simplex mode, the TX will transmit even when the port A RX is not connected.

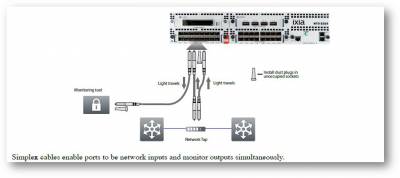
To “double your ports” you switch the port into simplex mode, then use simplex fiber cables and connect the TX fiber to a security or monitoring tool and the RX fiber to a tap or switch SPAN port. On NTO, the AFM ports such as the AFM 16 support simplex mode allowing you to have 32 connections per module: 16 network inputs and 16 monitor outputs simultaneously (with advanced functions on up to 16 of those connections). The Ixia xStream’s 24 ports can be used as 48 connections: 24 network inputs and 24 monitor outputs simultaneously.

The illustration below shows the RX and TX links of two AFM ports on the NTO running in simplex mode. The first port’s RX is receiving traffic from the Network Tap and the TX is transmitting to a monitoring tool.

The other port (right hand side on NTO) is interconnected to the Network Tap with its RX using a simplex cable whereas its TX is unused (dust-cap installed).

With any non-Ixia solution, this would have taken up three physical ports on the packet broker. With Ixia’s NTO and xStream packet brokers we are able to double up the traffic and save a port for this simple configuration, with room to add another monitoring tool where the dust plug is shown. If you expand this across many ports you can double your ports in the same space!

NTO Now Provides Twice the Network Visibility

Click here to learn more about Ixia’s Net Tool Optimizer family of products.

Additional Resources:

Ixia xStream

Ixia NTO solution

Ixia AFM

Solution Focus Category

Network Visibility

Thanks to Ixia for the article.

“Who Makes the Rules?” The Hidden Risks of Defining Visibility Policies

Imagine what would happen if the governor of one state got to change all the laws for the whole country for a day, without the other states or territories ever knowing about it. And then the next day, another governor gets to do the same. And then another.

Such foreseeable chaos is precisely what happens when multiple IT or security administrators define traffic filtering policies without some overarching intelligence keeping tabs on who’s doing what. Each user acts from their own unique perspective with the best of intentions –but with no way to know how the changes they make might impact other efforts.

In most large enterprises, multiple users need to be able to view and alter policies to maximize performance and security as the network evolves. In such scenarios, however, “last in, first out” policy definition creates dangerous blind spots, and the risk may be magnified in virtualized or hybrid environments where visibility architectures aren’t fully integrated.

Dynamic Filtering Accommodates Multiple Rule-makers, Reduces Risk of Visibility Gap

Among the advances added to latest release of Ixia’s Net Tool Optimizer™ (NTO) network packet brokers are enhancements to the solution’s unique Dynamic Filtering capabilities. This patented technique imposes that overarching intelligence over the visibility infrastructure as multiple users act to improve efficiency or divert threats. This technology becomes an absolute requirement when automation is used in the data center as dynamic changes to network filters require advanced calculations to other filters to ensure overlaps are updated to prevent loss of data.

Traditional rule-based systems may give a false sense of security and leave an organization vulnerable as security tools don’t see everything they need to see in order to do their job effectively. Say you have 3 tools each requiring slightly different but overlapping data.

  • Tool 1 wants a copy of all packets on VLAN 1-3
  • Tool 2 wants a copy of all packets containing TCP
  • Tool 3 wants a copy of all packets on VLAN 3-6

Overlap occurs in that both Tools 1 and 3 need to see TCP on VLAN 3. In rule-based systems, once a packet matches a rule, it is forwarded on and no longer available. Tool 1 will receive TCP packets on VLAN 3 but not tool 3. This creates a false sense of security because tool 3 still receives data and is not generating an alarm, which would indicate all is well. But what if the data stream going to tool 1 contains the smoking gun? Tool 3 would have detected this. And as we know from recent front-page breaches, a single incident can ruin a company’s brand image and have a severe financial impact.

Extending Peace of Mind across Virtual Networks

NVOS 4.3 also integrates physical and virtual visibility, allowing traffic from Ixia’s Phantom™ Virtualization Taps (vTaps) or standard VMware-based visibility solutions to be terminated on NTO along with physical traffic. Together, these enhancements eliminate serious blind spots inherent in other solutions avoiding potential risk and, worst case, liability caused by putting data at risk.

Integrating physical and virtual visibility minimizes equipment costs and streamlines control by eliminating extra devices that add complexity to your network. Other new additions –like the “double your ports” feature extend the NTO advantage delivering greater density, flexibility and ROI.

Download the latest NTO NVOS release from www.ixiacom.com.

Additional Resources:

Ixia Visibility Solutions

Thanks to Ixia for the article

Security Breaches Keep Network Teams Busy

Network Instruments study shows that network engineers are spending more of their day responding to breaches and deploying security controls.

This should come as no big surprise to most network teams. As security breaches and threats proliferate, they’re spending a lot of time dealing with security issues, according to a study released Monday.

Network Instruments’ eighth annual state of the network report shows that network engineers are increasingly consumed with security chores, including investigating security breaches and implementing security controls. Of the 322 network engineers, IT directors and CIOs surveyed worldwide, 85% said their organization’s network team was involved in security. Twenty percent of those polled said they spend 10 to 20 hours per week on security issues.

Security Breaches Keep Network Teams Busy

Almost 70% said the time they spend on security has increased over the past 12 months; nearly a quarter of respondents said the time spend increased by more than 25%.

The top two security activities keeping networking engineers busy are implementing preventative measures and investigating attacks, according to the report. Flagging anomalies and cleaning up after viruses or worms also are other top time sinks for network teams.

“Network engineers are being pulled into every aspect of security,” Brad Reinboldt, senior product manager for Network Instruments, the performance management unit of JDSU, said in a prepared statement

Security Breaches Keep Network Teams Busy

Network teams are drawn into security investigations and preparedness as high-profile security breaches continue to make headlines. Last year, news of the Target breach was followed by breach reports from a slew of big-name companies, including Neiman Marcus, Home Depot, and Michaels.

A report issued last September by the Ponemon Institute and sponsored by Experian showed that data breaches are becoming more frequent. Of the 567 US executives surveyed, 43 percent said they had experienced a data breach, up from 33% in a similar survey in 2013. Sixty percent said their company had suffered more than one data breach in the past two years, up from 52% in 2013.

According to Network Instruments’ study, syslogs were as the top method for detecting security issues, with 67% of survey respondents reporting using them. Fifty-seven percent use SNMP while 54% said they use anomalies for uncovering security problems.

In terms of security challenges, half of the survey respondents ranked correlating security and network performance as their biggest problem.

The study also found that more than half of those polled expect bandwidth to grow by more than 51% next year, up from the 37% from last year’s study who expected that kind of growth. Several factors are driving the demand, including users with multiple devices, larger data files, and unified communications applications, according to the report.

The survey also queried network teams about their adoption of emerging technologies. It found that year-over-year implementation rates for 40 Gigabit Ethernet, 100GbE, and software-defined networking have almost doubled. One technology that isn’t gaining traction among those polled is 25 GbE, with more than 62% saying they have no plans for it.

Thanks to Network Computing for the article.

How Not to Rollout New Ideas, or How I Learned to Love Testing

I was recently reading an article in TechCrunch titled “The Problem With The Internet Of Things,” where the author lamented how bad design or rollout of good ideas can kill promising markets. In his example, he discussed how turning on the lights in a room, through the Internet of Things (IoT), became a five step process rather than the simple one step process we currently use (the light switch).

This illustrates the problem between the grand idea, and the practicality of the market: it’s awesome to contemplate a future where exciting technology impacts our lives, but only if the realities of everyday use are taken into account. As he effectively state, “Smart home technology should work with the existing interfaces of households objects, not try to change how we use them.”

Part of the problem is that the IoT is still just a nebulous concept. Its everyday implications haven’t been worked out. What does it mean when all of our appliances, communications, and transportation are connected? How will they work together? How will we control and manage them? Details about how the users of exciting technology will actually participate in the experience is the actual driver of technology success. And too often, this aspect is glossed over or ignored.

And, once everything is connected, will those connections be a door for malware or hacktivists to bypass security?

Part of the solution to getting new technology to customers in a meaningful way, that is both a quality end user experience AND a profitable model for the provider, is network validation and optimization. Application performance and security resilience are key when rolling out, providing, integrating or securing new technology.

What do we mean by these terms? Well:

  • Application performance means we enable successful deployments of applications across our customers’ networks
  • Security resilience means we make sure customer networks are resilient to the growing security threats across the IT landscape

Companies deploying applications and network services—in a physical, virtual, or hybrid network configuration—need to do three things well:

  • Validate. Customers need to validate their network architecture to ensure they have a well-designed network, properly provisioned, with the right third party equipment to achieve their business goals.
  • Secure. Customers must secure their network performance against all the various threat scenarios—a threat list that grows daily and impacts their end users, brand, and profitability.

(Just over last Thanksgiving weekend, Sony Pictures was hacked and five of its upcoming pictures leaked online—with the prime suspect being North Korea!)

  • Optimize. Customers seek network optimization by obtaining solutions that give them 100% visibility into their traffic—eliminating blind spots. They must monitor applications traffic and receive real-time intelligence in order to ensure the network is performing as expected.

Ixia helps customers address these pain points, and achieve their networking goals every day, all over the world. This is the exciting part of our business.

When we discuss solutions with customers, no matter who they are— Bank of America, Visa, Apple, NTT—they all do three things the same way in their networks:

  • Design—Envision and plan the network that meets their business needs
  • Rollout—Deploy network upgrades or updated functionality
  • Operate—Keep the production network seamlessly providing a quality experience

These are the three big lifecycle stages for any network design, application rollout, security solution, or performance design. Achieving these milestones successfully requires three processes:

  • Validate—Test and confirm design meets expectations
  • Secure— Assess the performance and security in real-world threat scenarios
  • Optimize— Scale for performance, visibility, security, and expansion

So when it comes to new technology and new applications of that technology, we are in an amazing time—evidenced by the fact that nine billion devices will be connected to the Internet in 2018. Examples of this include Audio Video Bridging, Automotive Ethernet, Bring Your Own Apps (BYOA), etc. Ixia sees only huge potential. Ixia is a first line defense to creating the kind of quality customer experience that ensures satisfaction, brand excellence, and profitability.

Additional Resources:

Article: The Problem With The Internet Of Things

Ixia visibility solutions

Ixia security solutions

Thanks to Ixia for the article.

What if Sony Used Ixia’s Application and Threat Intelligence Processor (ATIP)?

Trying to detect intrusions in your network and extracting data from your network is a tricky business. Deep insight requires a deep understanding of the context of your network traffic—where are connections coming from, where are they going, and what are the specific applications in use. Without this breadth of insight, you can’t take action to stop and remediate attacks, especially from Advanced Persistent Threats (APT).

To see how Ixia helps its customers gain this actionable insight into the applications and threats on their network, we invite you to watch this quick demo of Ixia’s Application and Threat Intelligence Processor (ATIP) in action. Chief Product Officer Dennis Cox uses Ixia’s ATIP to help you understand threats in real time, with the actual intrusion techniques employed in the Sony breach.

Additional Resources:

Ixia Application and Threat Intelligence Processor

Thanks to Ixia for the article.