

Hawkeye: Active Network Monitoring
Take control of user experience with active / synthetic network performance monitoring
Highlights
An active network monitoring platform, Hawkeye makes it easy to do the following:
- take control of user experience with real-time QoS monitoring
- proactively detect, diagnose, and fix performance problems
- validate deployments by simulating live network traffic
- monitor distributed networks from core to edge
- troubleshoot outages faster with hop-by-hop visualization
Don't Fight Fires. Prevent Them with Hawkeye.
Your network is changing. SD-WAN, 5G, and edge computing affect how your network looks, how it behaves, and how quickly it reacts. Your users span cities, countries, and continents. But when customers and employees demand 24/7 access to critical applications, service outages can delay time-to-market, jeopardize customer loyalty, and erode your competitive advantage.
A next-generation network demands cutting-edge performance monitoring. That's why network operations teams trust Keysight Hawkeye to maintain quality of service (QoS) without the headaches.
What Does Hawkeye Do?
 Prevent Downtime with Active Monitoring
Don't wait for performance problems to cause costly downtime. With active network monitoring, you'll be the first to know when something goes wrong. Instead of waiting on users to discover and report issues, Hawkeye enables you to do the following:
measure user experience across your network and applications in real time
conduct distributed tests from on-premises or off-premises infrastructure
verify fixes in real-time with pass / fail metrics
find network and application issues faster with automated interval testing
track network trends proactively based on time-of-day and day-of-week of services
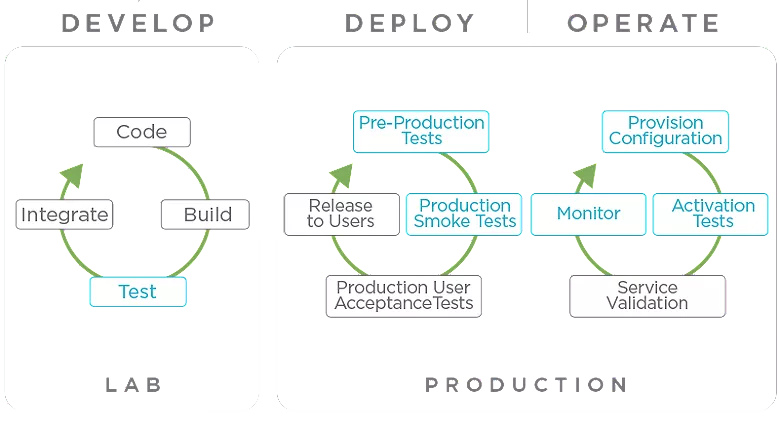 Validate Deployments Before and After Launch
Unlike active monitoring tools that rely on simple ping tests, Hawkeye uses realistic traffic simulations to accurately measure performance. Built on the same technology that underpins IxChariot — Keysight's pre-deployment performance testing platform — Hawkeye is an ideal tool for validating complex network deployments such as SD-WAN, before and after you go live.
 Monitor Your Network from Core to Edge
Unlike purely web-based active / synthetic monitoring tools, Hawkeye enables you to monitor the entirety of your network from a single tool. With a suite of physical, virtual, and cloud-based endpoints, you can track performance from your data center to your network's edge, including (but not limited to) the following areas:
- customer premises
- remote sites and head offices
- network aggregation points (PEs)
- core network, MPLS routers
- data centers
- cloud services (AWS, Azure, Google Cloud, virtual machines, and servers)
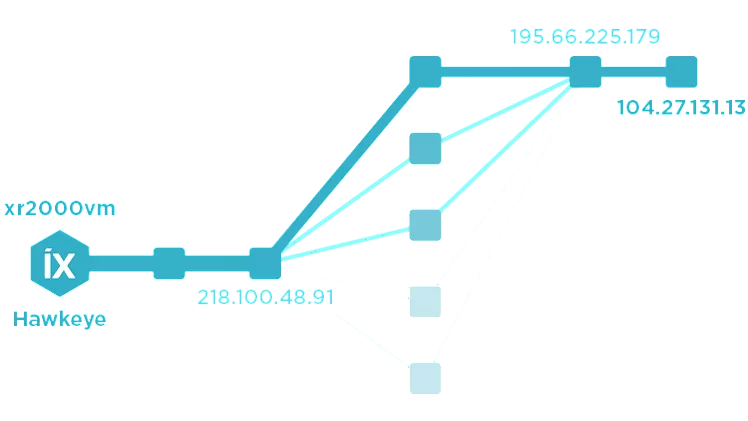 Save Precious Time with Path Discovery
Troubleshooting service interruptions is frustrating and time-consuming. Is the outage on your network, or is the problem coming from your service provider? Could it be an issue with one of your software-as-a-service (SaaS) applications? While you struggle to find the culprit, you lose valuable time and prolong costly outages. That's why Hawkeye shows you every step traffic takes on (and off) your network — enabling you to troubleshoot faster by quickly pinpointing faulty nodes.
 See All Your Performance Data In One Place
No one likes flipping between multiple dashboards and tools. That's why Hawkeye consolidates all your network performance data into a customizable, web-based interface. Here is a small sample of what our dashboard includes:
- real-time synthetic and inline traffic reporting
- automated alerts to help resolve issues faster
- product views to identify pain points quickly
- detailed drill downs by location, call/transaction, and specific metrics
- API integrations with leading network management systems
Measurements that Matter
 Active QoS Monitoring
Be the first to know what is happening on your network by monitoring user experience in real time. Active QoS monitoring helps you maximize uptime by identifying issues proactively and troubleshooting faster.
 Web and Application Monitoring
Your workforce is more distributed than ever. That's why Hawkeye makes it easy to maintain communication, coordination, and collaboration by ensuring consistent, quality access to local and cloud-based services.
 Wi-Fi Monitoring
The explosive growth of mobility, bring your own device, and the Internet of Things demand you ensure the best Wi-Fi connectivity is available. That's why Hawkeye helps you detect outages and bottlenecks before they impact user experience.
 Cloud Monitoring
Cloud-hosted infrastructure sends critical traffic beyond your network to reach SaaS applications. With Hawkeye, you get visibility into the cloud to proactively detect, troubleshoot, and remediate access issues.
Hawkeye Use Cases
 As an active monitoring platform, Hawkeye is an ideal tool to continuously manage performance and connectivity across your network. Hawkeye makes it simple for you to monitor remote sites, data centers, cloud services and more — all from a single tool.
Whether you're measuring remote user experience over voice applications, branch office users on Wi-Fi, or general connectivity to your SaaS applications, it's easy to monitor, manage, and maintain peak performance. With Hawkeye, you can do all this and more:
- choose from a robust library of pre-defined QoS tests
- monitor voice, video, and unified communications tools with turnkey integrations
- cut through clutter with clear pass / fail metrics
- see all your performance data in a single interface
- set custom alarm thresholds based on individual quality standards
Solution Brief
White Paper
 Successful SD-WAN migrations depend on the ability to monitor application performance closely and troubleshoot issues — both before and after you deploy. That’s why so many organizations count on Hawkeye to streamline SD-WAN deployment, turn up, and maintenance.
With Hawkeye, you get all the tools you need to ensure a successful migration — pre- and post-deployment — including the following:
- architecture and design verification
- service level agreement (SLA) and quality-of-experience (QoE) analysis
- active core-to-edge performance monitoring
- 24/7 link and circuit verification
- proactive issue identification and troubleshooting
White Paper
 Corporations have been evolving toward a more distributed workforce for more than a decade, but the widespread shift to remote work is stressing day-to-day IT operations. Network operations teams need to identify and address performance issues swiftly, but an increasingly remote workforce adds complexity and makes troubleshooting harder.
You need to focus on business, not whether the next conference call is going to work. That's why network operations teams trust Hawkeye to help them accomplish the following:
- verify network readiness proactively
- validate QoE, troubleshoot bottlenecks, and fix outages fast
- identify and resolve latency problems before they impact end users (remote and on-premises)
- pinpoint where to increase bandwidth or adjust QoS
- detect whether performance issues stem from your network, your carrier, your applications, or your users’ connections
Solution Brief
White Paper
 Reducing latency and maintaining peak performance are critical concerns for edge computing. When employees, consumers, and branch locations all depend on your network's edge, you need a holistic view of QoS that goes well beyond your data center.
You need a monitoring strategy. Keysight can help. Hawkeye offers a diverse range of edge-optimized monitoring endpoints so you can capture actionable intelligence from every corner of your network:
- Virtual endpoints: compatible with a range of virtual platforms and cloud applications
- XR3000: Active monitoring appliance with rich connectivity including fixed up to 10G and Wi-Fi 6
- Vision E1S: Hawkeye-enabled network packet broker
- IxProbe: inline monitoring probe combining real-time monitoring, SLA verification, and synthetic QoS testing
White Paper
 For network service providers, the clients who count on them, and large enterprises that operate SD-WANs, SLAs are the pulse of business. As network speeds rise, managing SLAs is critical for ensuring that all parties deliver their expected speeds or get what they paid for.
However, last-mile blind spots can make this troublesome — especially for service providers that sub-contract last-mile connectivity. Without visibility into branch locations and remote sites, troubleshooting issues and maintaining QoS are significantly harder.
IxProbe, an inline monitoring probe, solves this exact problem. A Hawkeye endpoint combining real-time monitoring, SLA verification, and synthetic QoS testing, IxProbe puts you in control of your network's edge with fewer truck rolls, faster troubleshooting, and effortless deployment at scale.
Products
Solution Brief

What is Active Monitoring?
Get in Front of Network Performance Issues, Don't React to Them
When your business depends on peak performance, you cannot afford to wait until your monitoring tools detect a problem. You need to get proactive. That is where active monitoring (also known as synthetic monitoring) proves its worth.
Cut Through the Clutter with Machine Learning
As the volume and velocity of raw network and application data continue to increase, network operations teams often struggle to correlate raw performance metrics with actual network problems. With so much information coming from so many places, it's easy to get overwhelmed.
That's why Hawkeye uses machine learning to help network operations teams make sense of their increasingly complex networks. With automatic threshold and outlier detection, Hawkeye cuts through the clutter and immediately notifies you of potential problems. An outlier dashboard enables fast drill-downs and root-cause analysis, while flexible sensitivity criteria make it easy to customize alerts to match specific quality thresholds.


Featured Resources
Data Sheets
- Hawkeye – Active Network Monitoring Platform
- Keysight Vision Edge 1S (E1S) Edge Visibility Appliance
- Vision Management Appliance
- IxProbe – Inline/Synthetic QoS Monitoring for Service Providers and Enterprises
Solution Briefs
- Hawkeye: Prevent Costly Outages with Active Network Monitoring
- Hawkeye + SSL VPN Gateway Assessment
- IxProbe + Hawkeye: Helping Service Providers Take Control of Last-Mile Delivery
Case Studies
White Papers
- Five Ways to Improve Network Performance with Active Monitoring
- SD-WAN 101: Ensuring Peak Network Performance and Service QoE
- The New Normal: Six Keys to Optimize User Experience for Employees Working from Home
- Edge Computing: Four Smart Strategies for Safeguarding Security and User Experience